Current Flow & Voltage Animation in TINACloud

Current Flow & Voltage Animation in TINACloud

Good news! As a 2020 holiday gift we have added Current flow and voltage animation to TINACloud. 
And yes, the same feature will be also available next year in the offline versions of TINA.

Current and voltage animation is an especially useful pedagogical tool. You can make outstanding presentations showing animated current flows and voltages for your presentations, textbooks, or assignments.

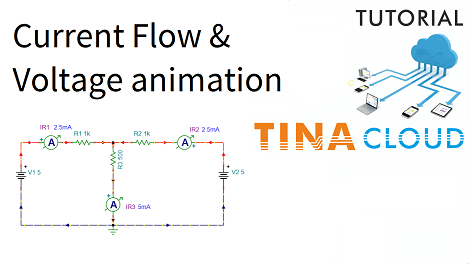
In this tutorial video, we demonstrate the DC current flow and voltage animation feature of TINACloud.

We present this through a DC example included in TINACloud.

To see the animation feature, first we have to enable it in the Options dialog under the Analysis menu.

Next, we click the DC button.

The program will demonstrate the current flow with running dashes. The program will also mark the direction of the currents with filled current arrows.

The color of the dashes also indicates the value of voltages. Positive values are red, and negative values are blue. When the voltage reaches zero the color turns black.

You can read more about this topic including animation in time here.

To watch our tutorial please click  here.

You can learn more about TINA here: www.tina.com

You can learn more about TINACloud here: www.tinacloud.com


Happy Holidays!

How to analyze circuits in time domain with TINACloud?

How to analyze circuits in time domain with TINACloud?

In this tutorial video, we will demonstrate and compare the tools available in TINACloud for analyzing circuits in time domain.

In TINACloud, you can analyze circuits in time domain, employing two different tools:

1.Transient analysis from the Analysis menu of TINACloud.

2.Simulated Virtual Oscilloscope from the T&M menu of TINACloud.

1. Transient Analysis.

First, we analyze the Collpit Oscillator circuit with Transient analysis.

The Transient analysis calculates the time response of circuits and presents the results as diagrams or text.

You have to set the Start Display and End Display parameters.

For COLPITTS.TSC it is preset, but for new circuits, You have to estimate it based on circuit operation.

It is also important to select an option related to the Start condition.

For oscillators, like our circuit, the Zero initial values option applies.

You can refine the diagram in several ways. Here are a few:

  • Zoom into any part of the diagram.
  • Run cursors on the curves of the diagram.
  • Calculate the frequency of the oscillation.
  • Mark a period of the signal with the cursors.
  • You can also find the Local or Global Minimum or Maximum by clicking the actual value field of a curve.
  • Separate the curves or collect them in one diagram.
  • You can insert the diagram into the schematics and save them together.
2. Simulated Virtual Oscilloscope

In practice we very often use an oscilloscope to measure, analyze and debug circuits in the time domain. So, it seems obvious that a simulated oscilloscope can be used in circuit simulation as well.

First, Invoke the Oscilloscope from the T&M menu of TINACloud and then press the Run button.

The Out1 signal appears.

In this video we present how to use the controls to make the curve bigger and more detailed.

Also you can learn about how to stabilize the waveforms on the Oscilloscope, or bring in the Vout signal as well.

We also show how you can fine-tune your circuit until both signals (Out1 and Vout) become sinusoidal.

Finally, we present step by step how you can get the same signal on the Oscilloscope as provided by the previous Transient Analysis.

To watch our tutorial please click  here.

You can learn more about TINA here: www.tina.com

You can learn more about TINACloud here: www.tinacloud.com

How to Create a DC Transfer Characteristic in TINACloud

How to Create a DC Transfer Characteristic in TINACloud

In this short video tutorial, we will show how to create a DC Transfer Characteristic in TINACloud through an example of a differential amplifier circuit.

First we open the DIFFAMP.TSC differential amplifier circuit from the circuit collection of TINACloud, then we select DC Analysis form the Analysis menu.

Next, we click DC Transfer Characteristic…

In the The “Run DC Transfer Analysis” window we select Vin as Input from the Input list. Vin is the name of the generator in the circuit.

We set the Start value and End value of Vin and then we click the Run button.

The DC Transfer Characteristic Diagram appears.

To watch our tutorial please click  here .

You can learn more about TINA here: www.tina.com

You can learn more about TINACloud here: www.tinacloud.com