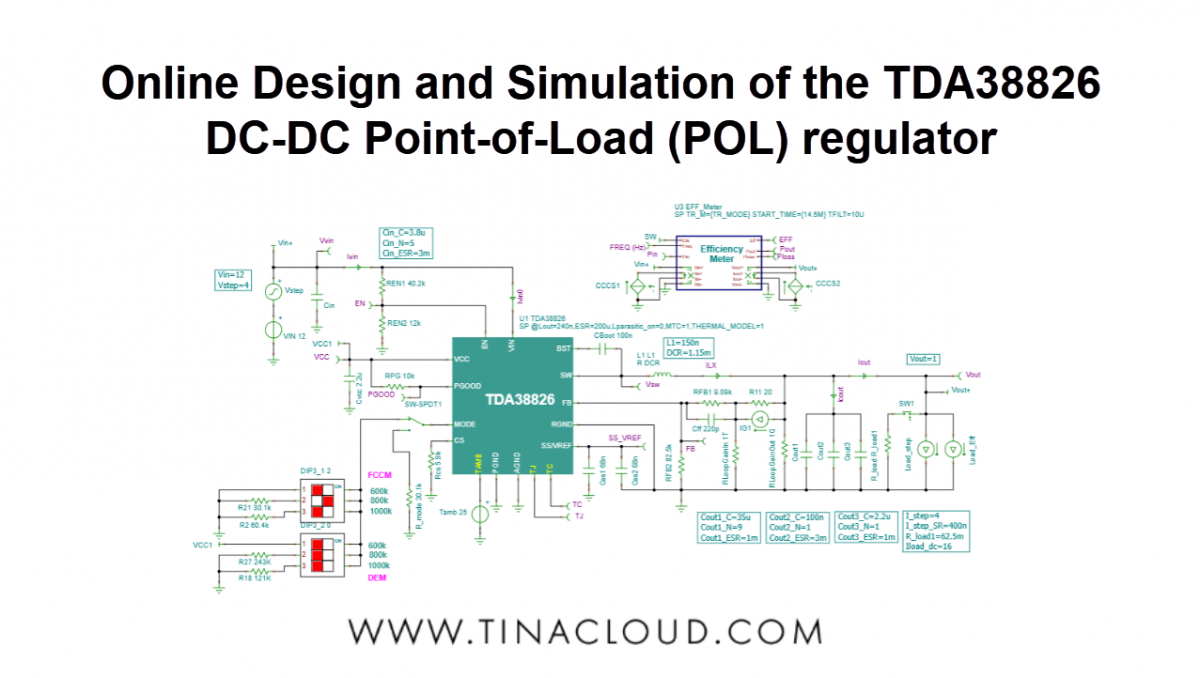
We’ve put together a new video tutorial showing how to efficiently design and simulate power management circuits in TINACloud, using the Infineon’s TDA38826 DC-DC Point-of-Load (POL) regulator as the featured example. While this video focuses on TINACloud, you can also use the offline TINA program.
The datasheet of this device can be found on the Infineon website and was used to create the SPICE model for TINA and TINACloud by DesignSoft.
This model runs not only in TINA and TINACloud, but also in major SPICE programs including PSpice, SIMetrix, LTspice, and more.
The video covers the following topics:
- Startup Transient Analysis
- Steady State analysis
- Line and Load Step Analysis
- AC Analysis
- Efficiency Analysis
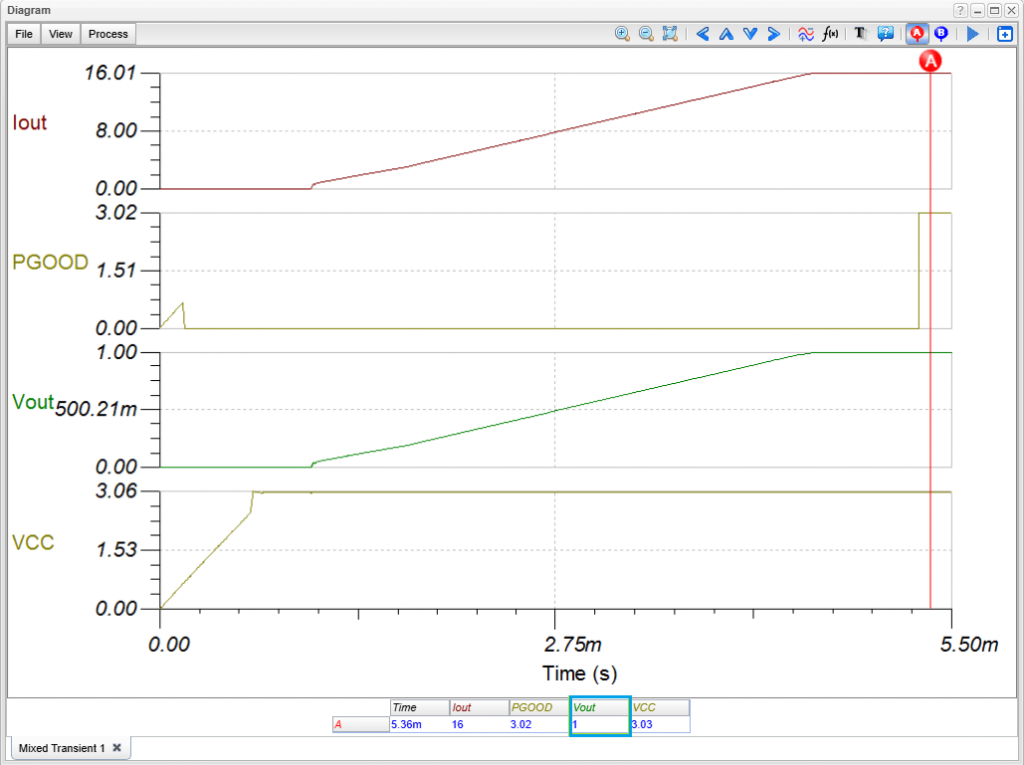
Startup Transient Analysis
A startup transient is the time a DC-DC converter takes to go from an off state to a stable, steady-state condition. Traditionally, simulating this can be time-consuming. However, TINA and TINACloud use a built-in average model that significantly speeds up this process, taking only a few seconds.
For more detailed results, the software can perform a switching-mode transient analysis, which is still fast thanks to its advanced multi-core solvers. Additionally, TINA and TINACloud can quickly calculate ripple voltages by combining the average and switching models.
To begin, you’ll open the “TDA38826 DC-DC Point-of-Load (POL) regulator integrated” circuit file from the TINA Examples folder.
Running a Simulation
To perform a fast transient analysis, click the “Transient Analysis Fast” link or select “Transient…” from the Analysis menu. By default, the “Use switching model” checkbox is unchecked, ensuring the fast average model is used. After clicking “Run”, a diagram will show the startup transient’s time function, with an output voltage of 1V.
Redesigning the Circuit
TINA and TINACloud’s Design Tool can automatically adjust circuit parameters to meet a new output voltage target. For example, let’s change the output from 1V to 3.3V.
Select “Re-design this circuit” from the Tools menu or double-click the text box on the circuit. In the dialog box, simply change Vout to 3.3V and click “Run”. The Design Tool will automatically adjust the necessary components, highlighting them in red. After running the transient analysis again, you can use a cursor to confirm the new output voltage is approx. 3.3V.
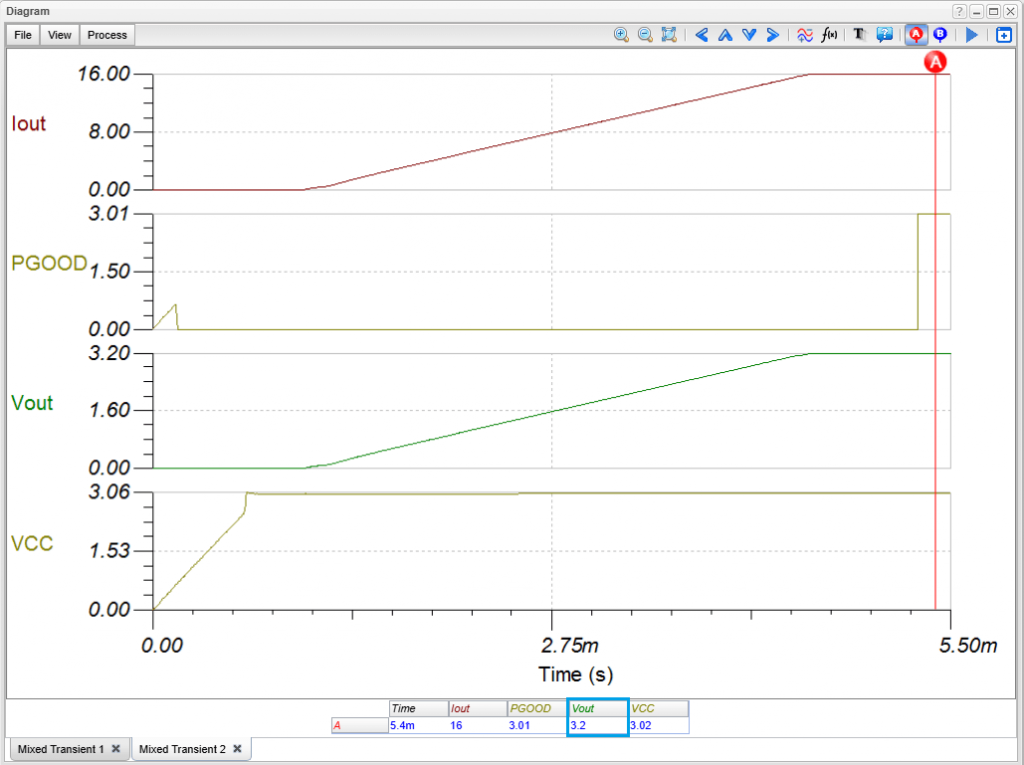
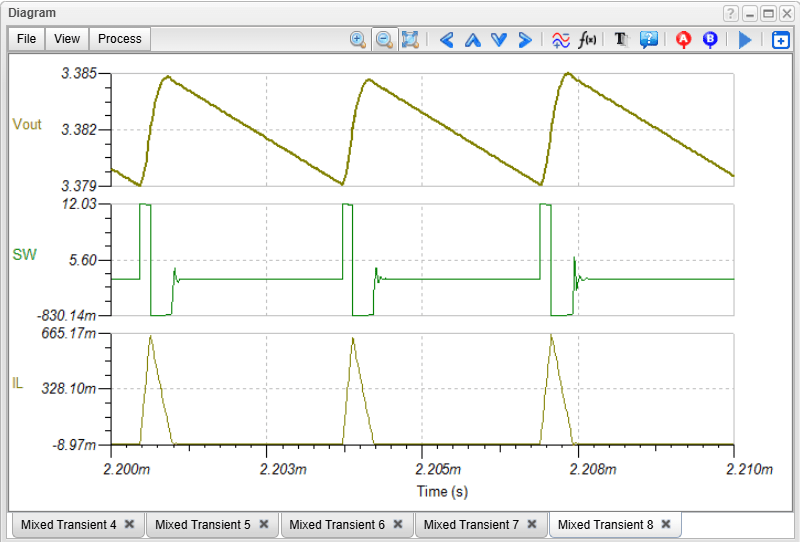
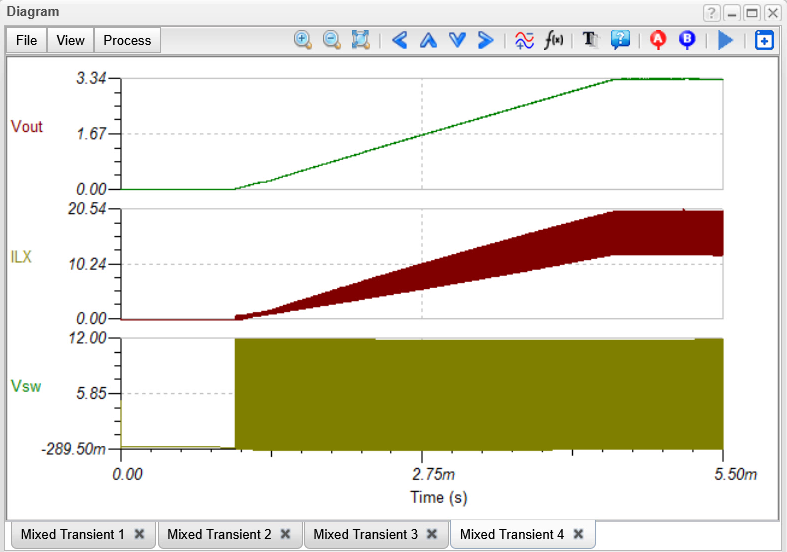
For a more accurate simulation, you can run the switching model by clicking the “Transient Analysis Accurate” link or checking the “Use switching model” box in the Run Transient Analysis dialog. The calculation may take a few minutes, and the Vout curve will be very similar to the one from the average model. The key difference is that the switching model will show the ripple, which the average model does not. You can zoom in on the diagram to see the ripple voltage waveform more clearly.
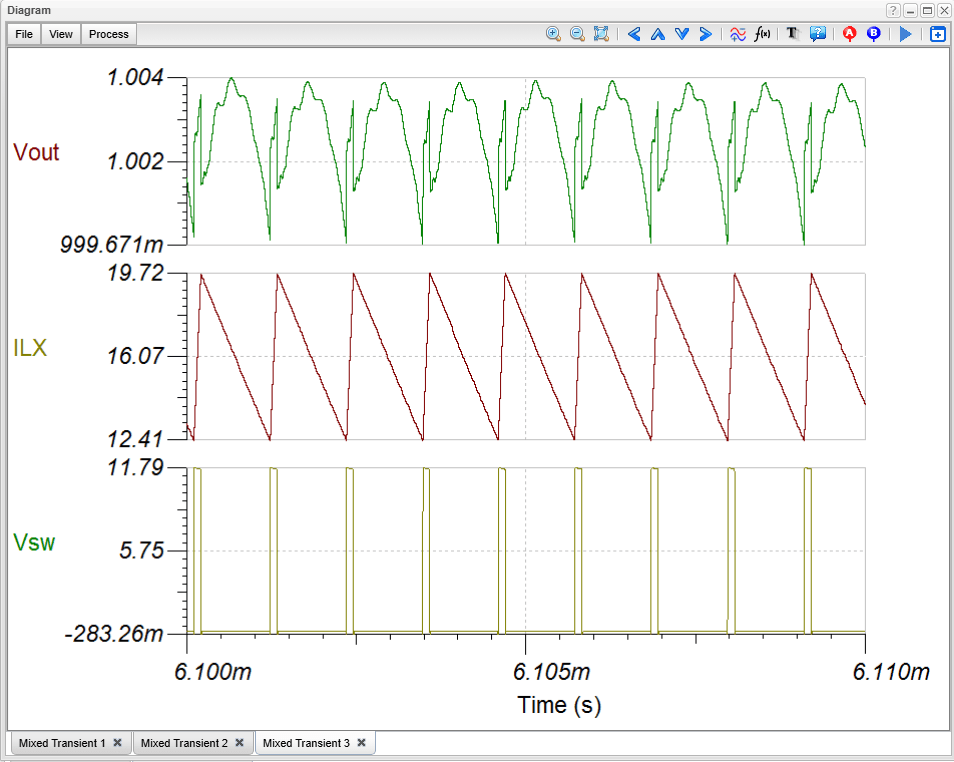
Steady-State and Ripple Voltage Analysis
Steady-state analysis examines a circuit’s behavior after all transients have settled. This is crucial for quickly determining ripple voltages. This method is fast because it doesn’t require storing initial inductor and capacitor values. Using the same circuit file, you can perform a transient analysis to view the ripple voltages and currents.
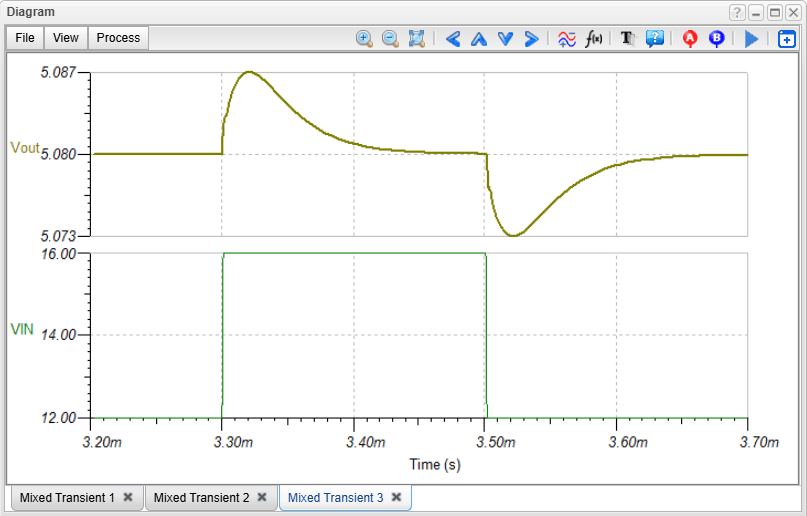
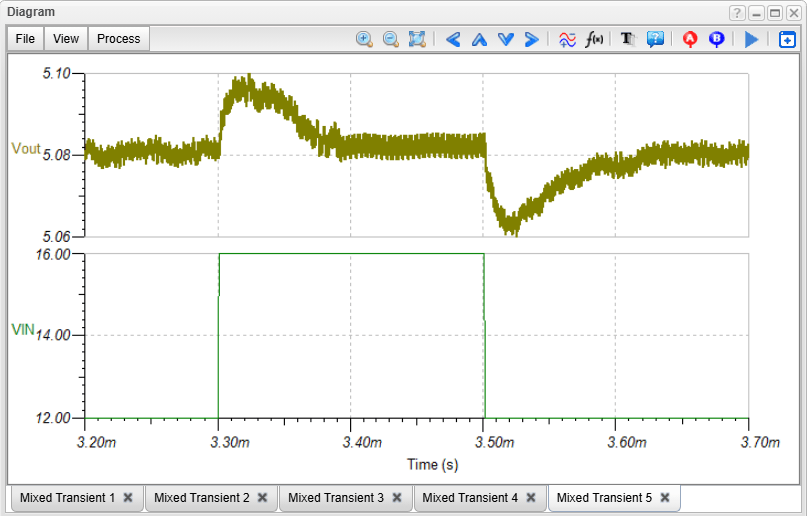
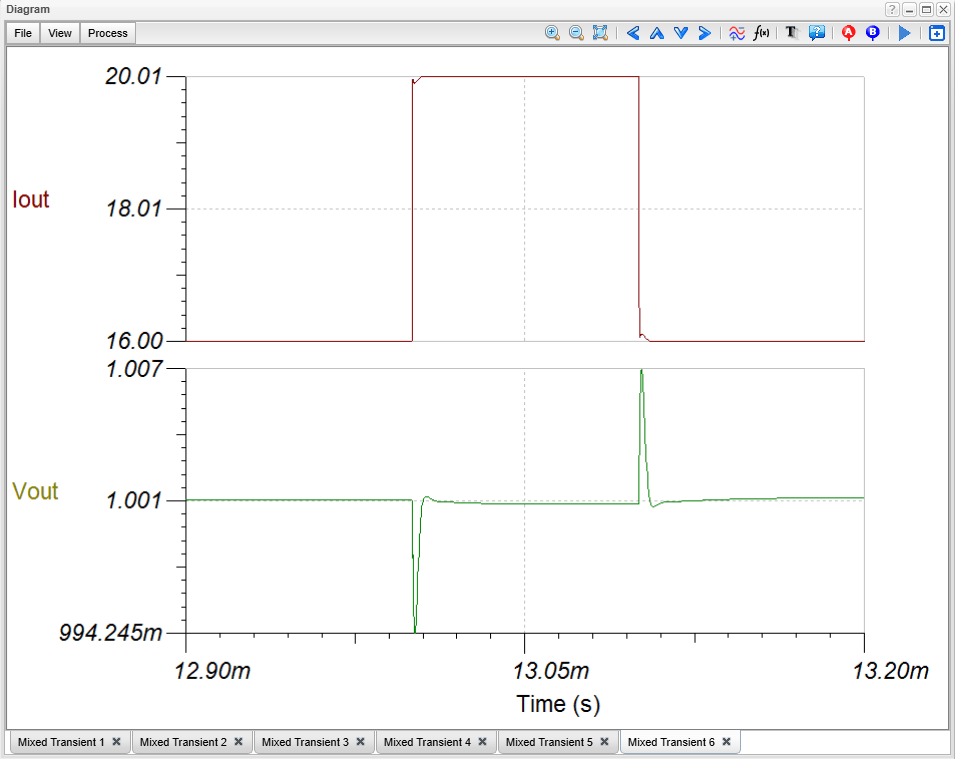
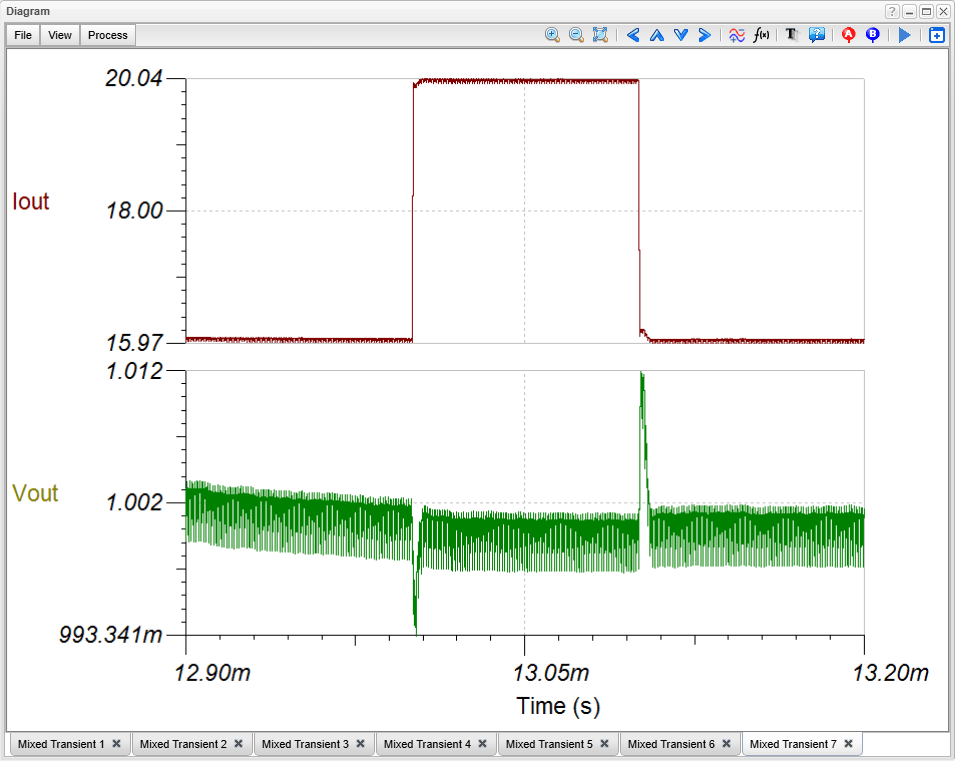
Line and Load Step Analysis
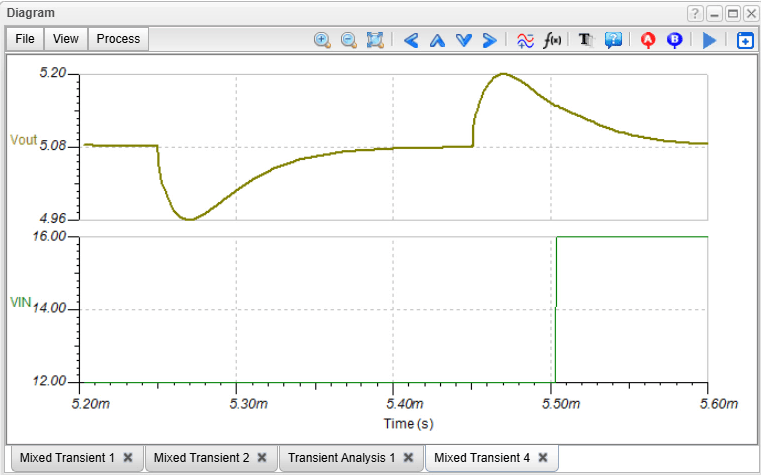
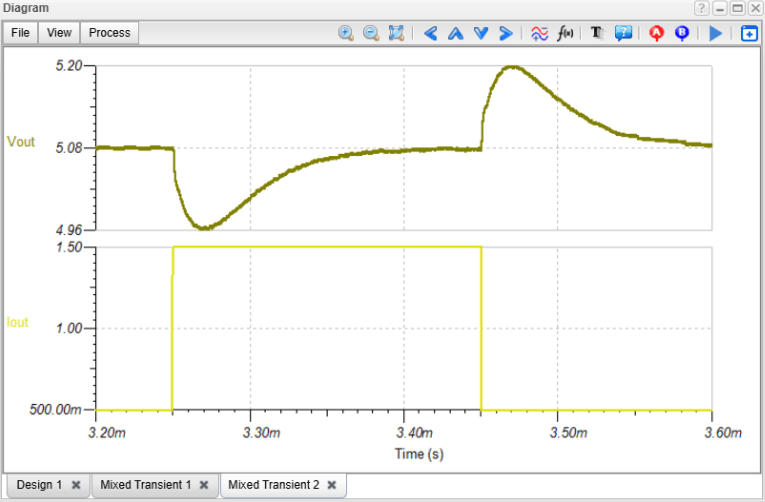
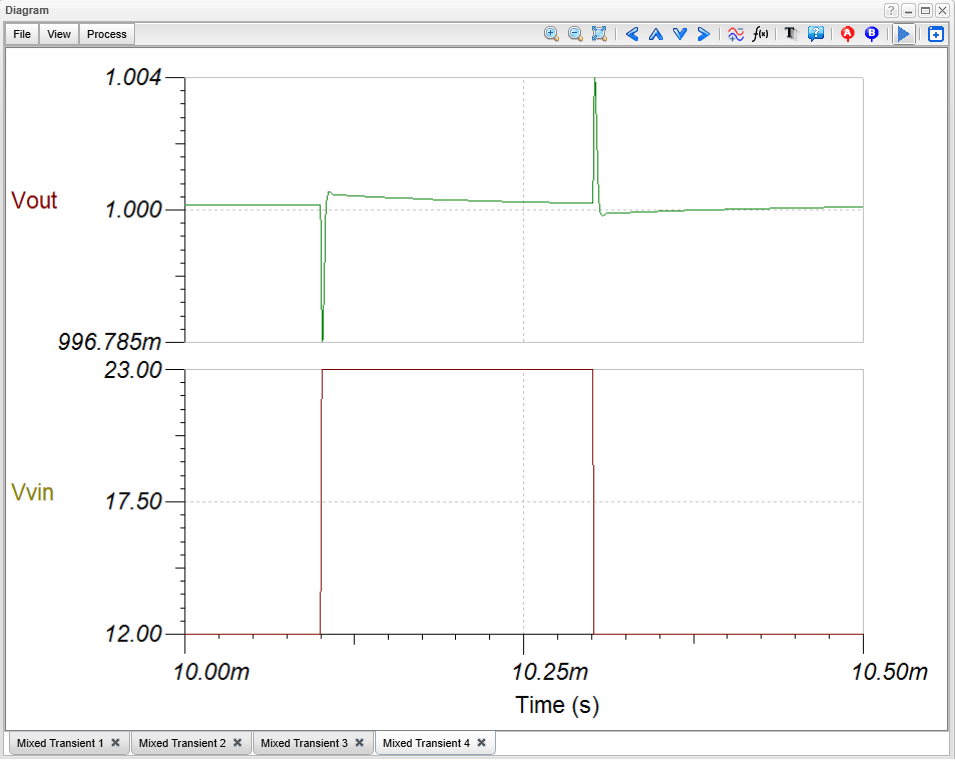
TINA and TINACloud can quickly simulate how a DC-DC converter responds to sudden changes in input voltage (line step) or load current (load step).
Line Step Analysis
To see the circuit’s response to an input voltage change, click the “Line Step Analysis Fast” link. A diagram of the circuit’s response, including the full ripple voltage, will appear within seconds
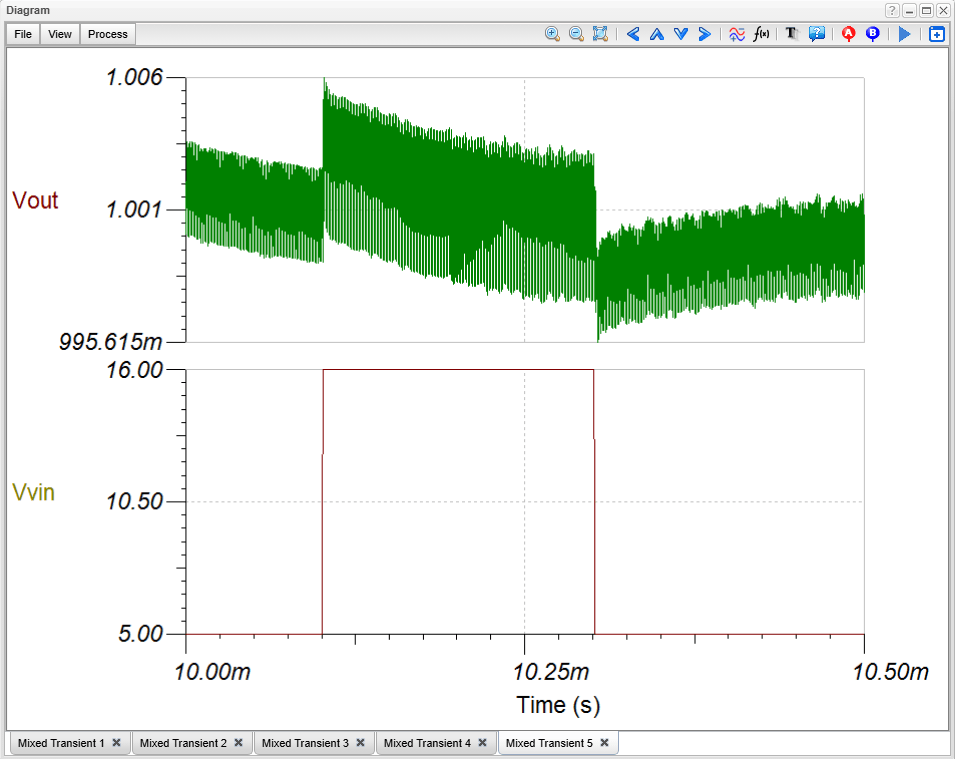
Load Step Analysis
To see the circuit’s response to a load current change, click the “Load Step Analysis Fast” link. The diagram will appear almost instantly. You can also run a more accurate, switching-mode version of this analysis by checking the “Use switching model” box.
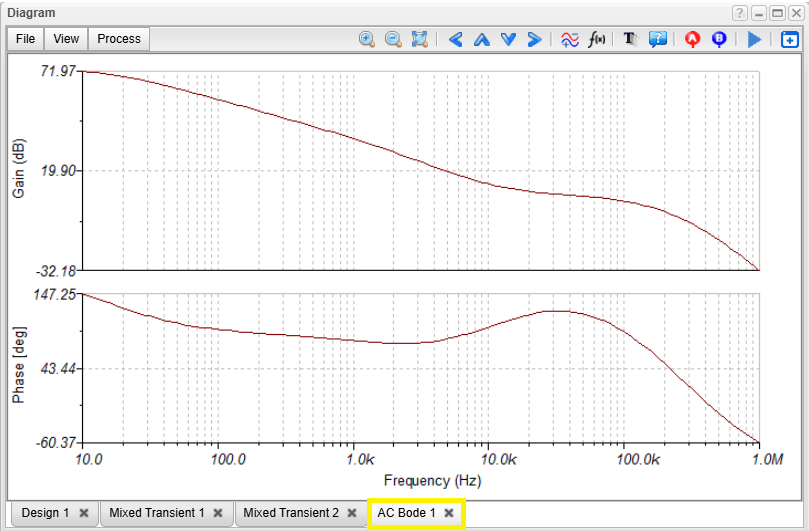
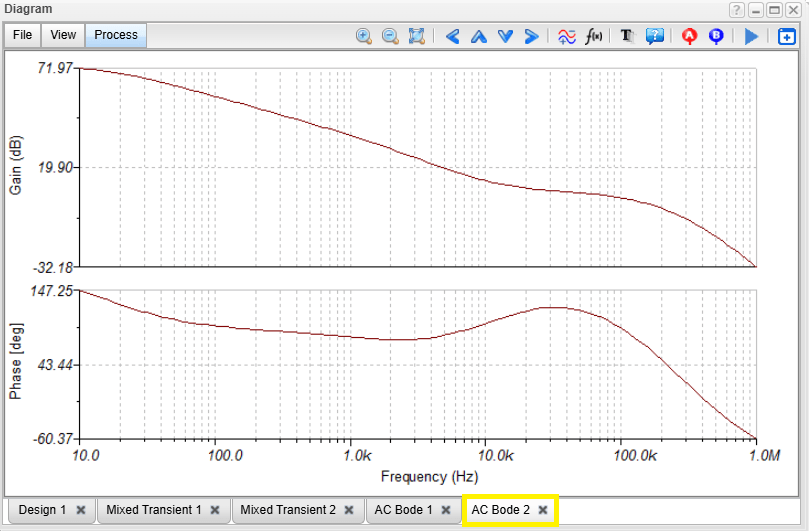
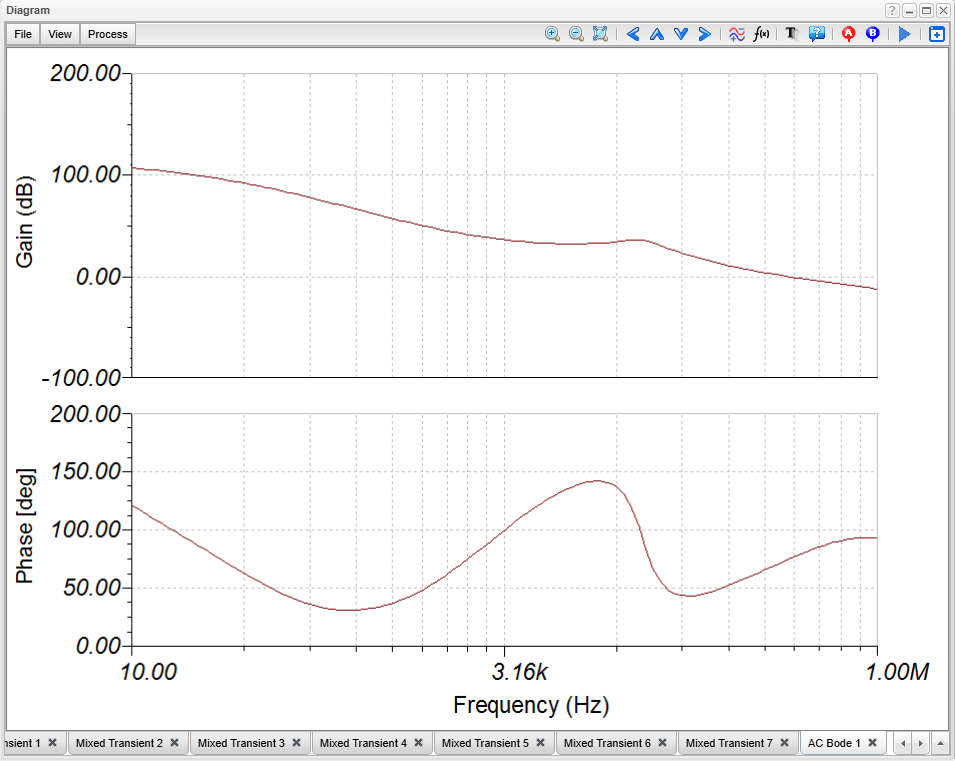
AC Analysis
The built-in average models also allow for fast and accurate AC analysis. By clicking the “AC Transfer Characteristic” link or selecting “AC Analysis” from the menu, you can display the AC Bode diagram of the loop gain.
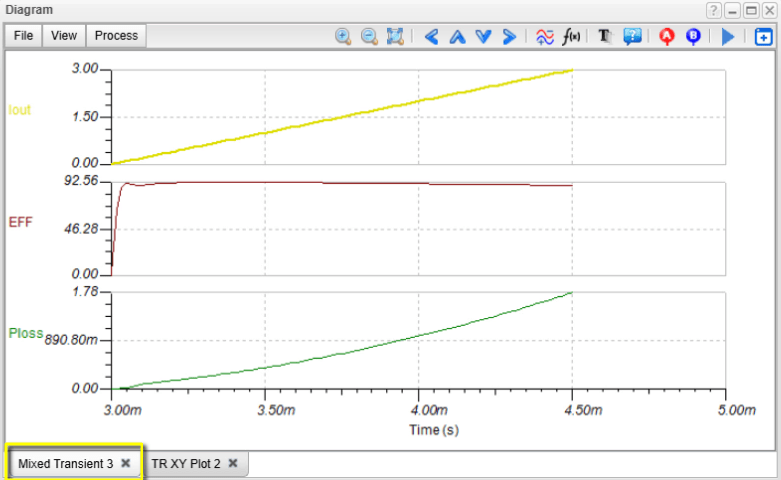
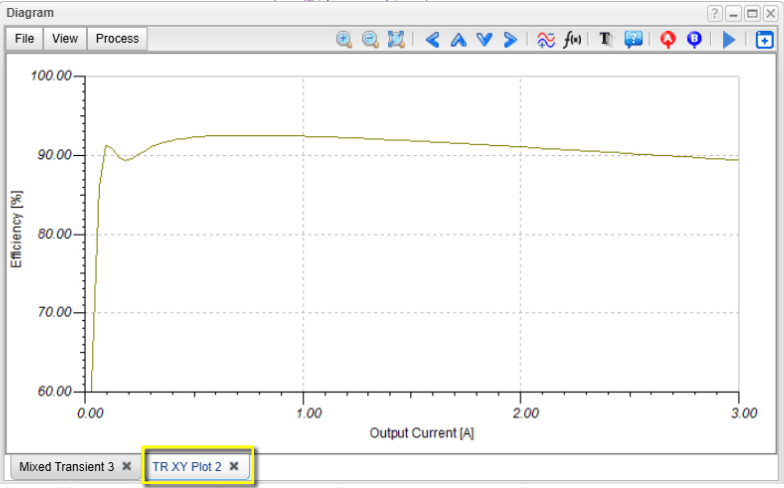
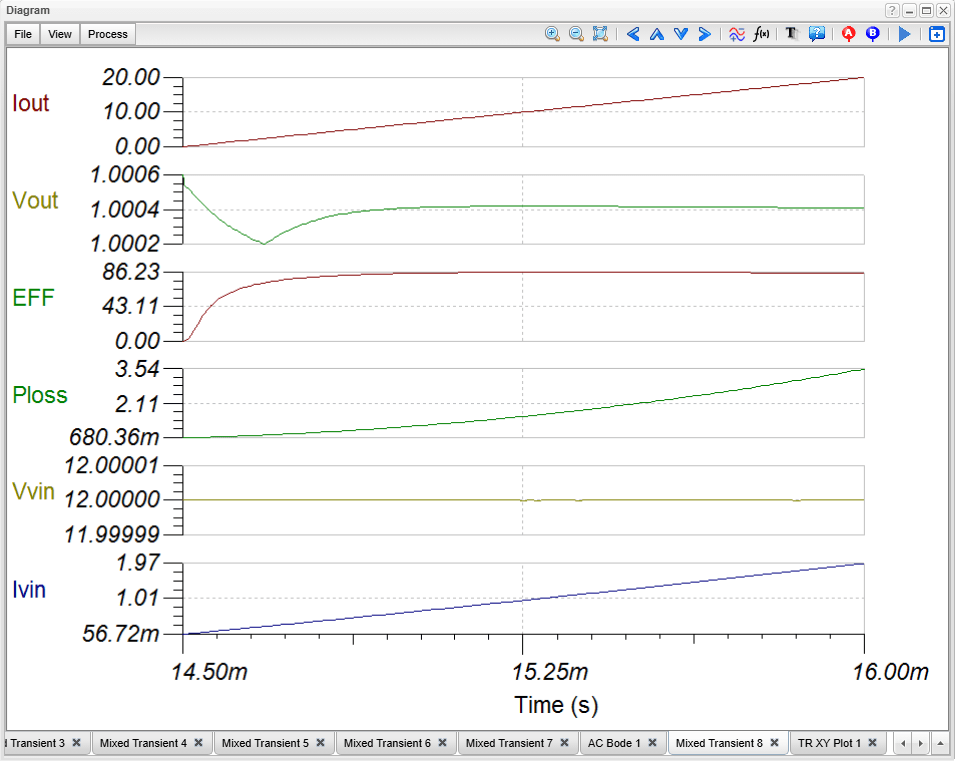
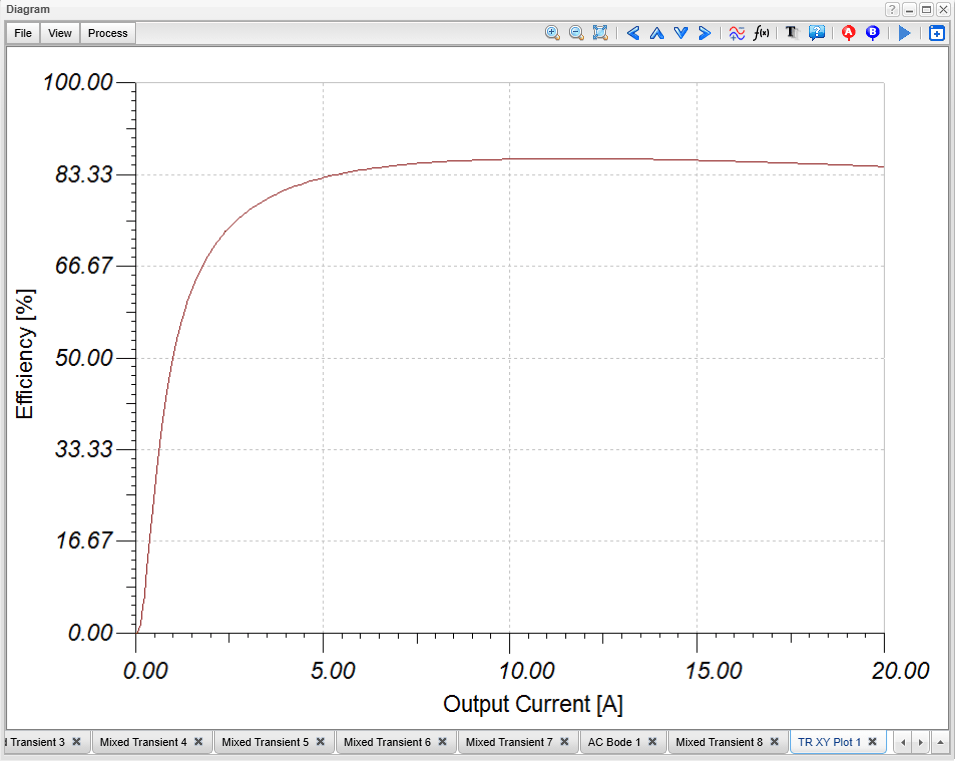
Efficiency Analysis
TINA and TINACloud can quickly calculate and plot efficiency as a function of time and load current. Clicking the “Efficiency Analysis Fast” link will generate a diagram showing efficiency versus time. By switching to the TR XY Plot Tab, you can also view efficiency as a function of the output or load current.
This concludes the video tutorial on analyzing the key characteristics of the TDA38826 DC-DC Point-of-Load (POL) regulator using TINACloud.
You can learn more about TINACloud here: www.tinacloud.com
You can learn more about TINA here: www.tina.com
Explore more content from our channel: https://www.youtube.com/@TinaDesignSuite