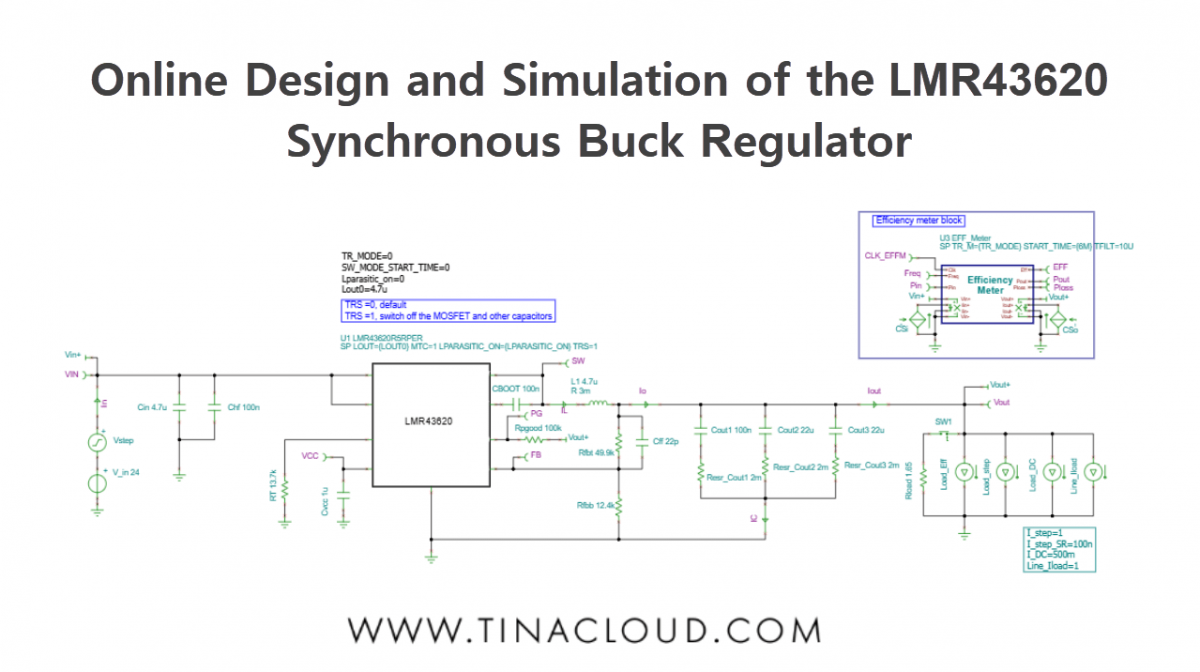
We’ve created a new video tutorial that explores how to quickly and accurately design and simulate power management circuits with TINACloud, this time using the LMR43620 Synchronous Buck Regulator as an example. You can also use the offline TINA program for analyzing this circuit.
The datasheet of this device can be found on the Texas Instruments website, and was used to create the SPICE model for TINA and TINACloud by DesignSoft. This model runs not only in TINA and TINACloud, but also in major SPICE programs including PSpice, SIMetrix, LTspice, and more.
We will cover the following topics:
- Startup Transient Analysis
- Steady State Analysis
- Line Step Analysis
- Load Step Analysis
- AC Analysis
- Efficiency Analysis
1. Startup Transient Simulation
The startup transient of a DC-DC converter is the period of time during which the converter is transitioning from its off state to its steady-state operating condition. In most simulators the Startup Transient simulation takes a long time since the whole process from the initial state to steady state is simulated.
However due to the built in average model in TINA and TINACloud the simulation takes only seconds both online and offline.
TINA and TINACloud can also be used to perform switching mode transient analysis. Due to the advanced multicore solvers in both software, switching mode transient analysis is still quite fast and results in more detailed waveforms.
In addition, TINA and TINACloud include a very fast calculation of the ripple voltages using the combination of the average and switching models.
Let’s load the LMR43620 Multiple Simulations.TSC circuit from the TINA Examples folder.
This circuit allows you to run all the necessary simulations for characterizing the LMR43620 from the same file, but separate circuit files for each simulation are also included in the folder.
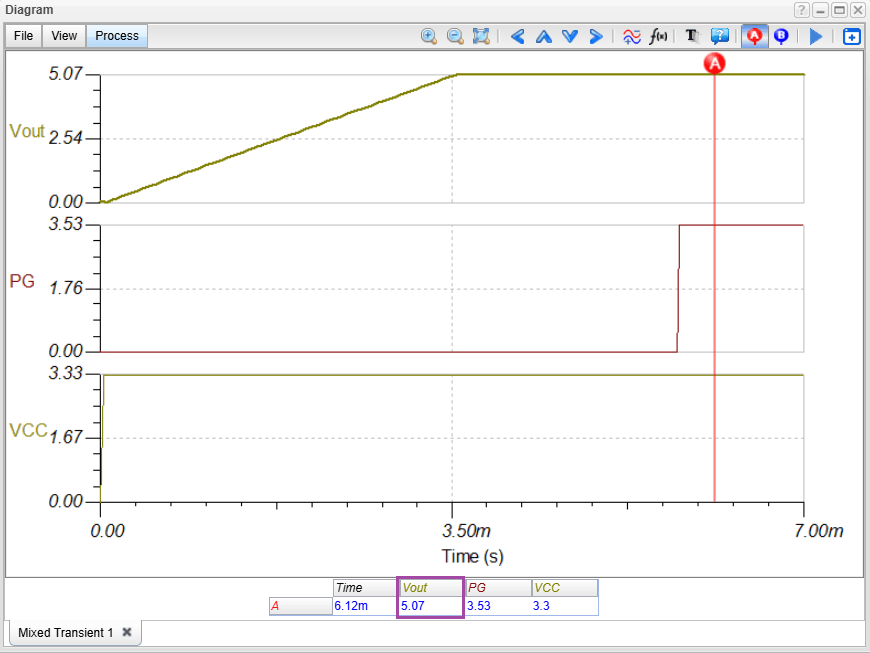
For running Transient Analysis, click the Transient Analysis Fast link or select Transient… from the Analysis menu. Note that by default the Use switching model checkbox is not checked. This means that the fast average model is used.
By pressing the Run button, the time function of Startup Transient appears within a few seconds. If you click on the top-right of the Startup diagram and run a cursor on it, you can check that the output voltage is approx. 5 V.
Redesigning the circuit
TINA and TINACloud’s Design Tool can determine circuit parameters to achieve a predefined target output.
To use the Design Tool select Re-design this circuit from the Tools menu, or double click the text box on the left side of the current circuit. The Design Tool dialog appears. So far the Vout voltage has been 5V. Let’s redesign the circuit to generate a 3.3 V output voltage. To do this, change Vout to 3.3 and press Run. The following screen appears:
The Design Tool displayed a quick diagram of all the relevant analysis results, based on analytic calculations.
If you click on the top-left of the Startup diagram and run a cursor on it, you can check that the output voltage is now indeed 3.3 V.
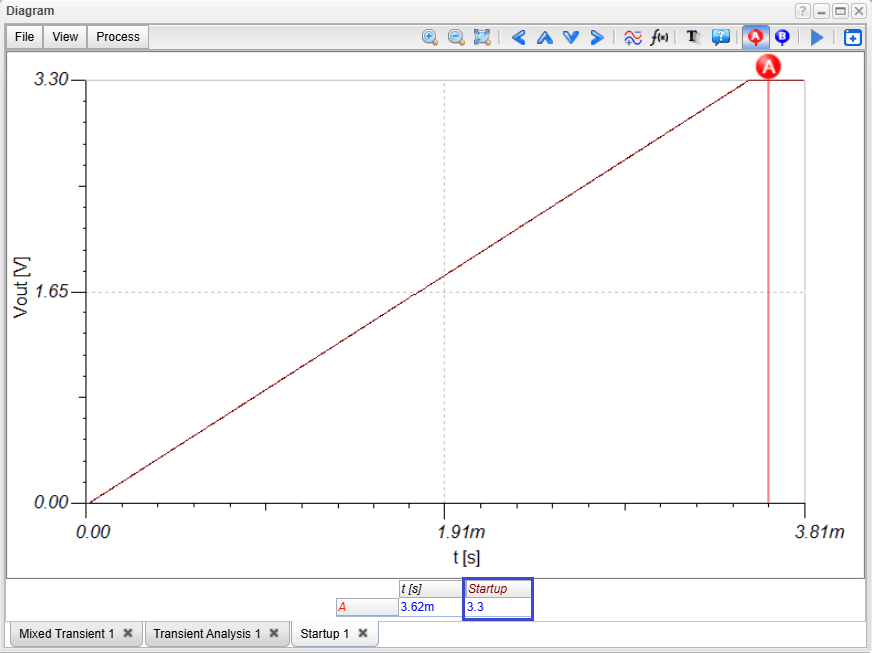
LMR43620 circuit: Startup Transient analysis after redesigning the circuit
You can also run a more accurate numerical Transient simulation on the redesigned circuit and see that it provides nearly the same result as the analytic result.
Finally, you can also run the switching model if you click the Transient Analysis Accurate link, or check the “Use switching model” checkbox at the Run Transient Analysis dialog.
Depending on cloud traffic, the simulation in TINACloud may take a few minutes, but the Vout output remains nearly identical to the result from the average method, which completes in seconds. Note, that compared to TINACloud, switching mode simulations typically run much faster in the offline TINA program- especially on high-performance, multi-threaded machines.
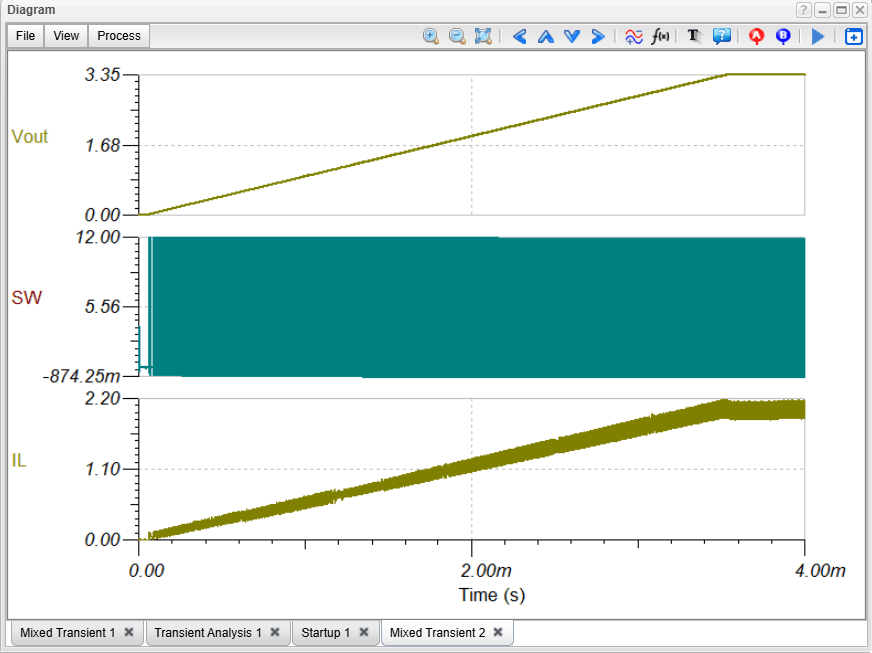
Let’s select the output voltage. The only difference is in the Ripple which is not provided by the average model. If we zoom in, we can see the ripple voltage waveform more clearly.
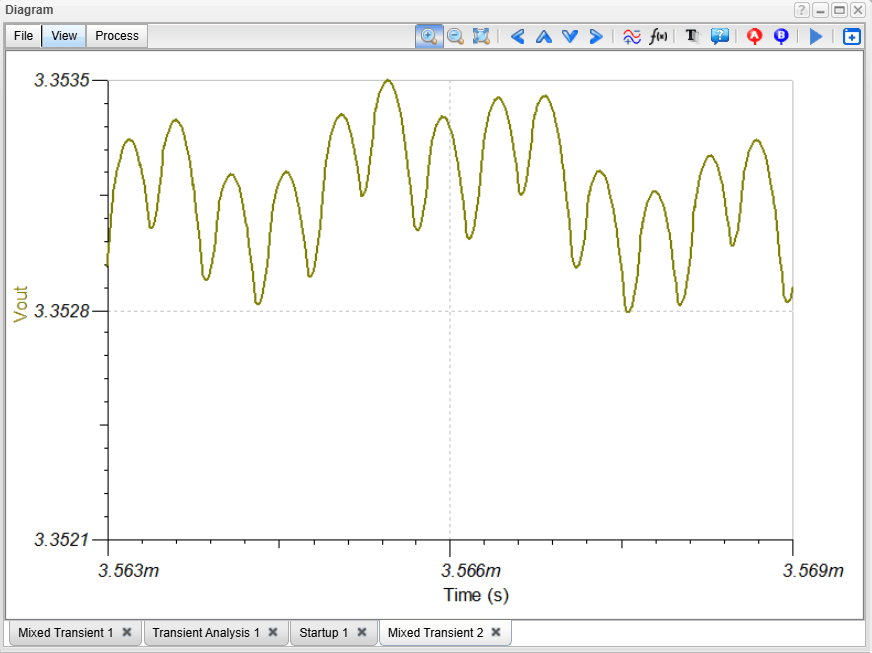
However, switching mode analysis takes considerable time, and the small ripple voltage makes zooming in quite difficult. To solve this problem, TINA and TINACloud feature a fast and accurate method for the direct calculation of ripple voltages in steady state.
2. Steady State Analysis
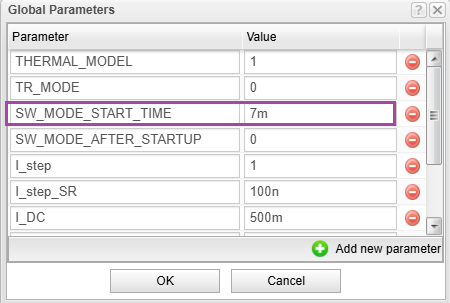
Steady state analysis of a DC-DC power supply is the analysis of the circuit’s behavior when it has reached a steady state. This means that the output voltage is constant, except for the ripple voltage, and all the components in the circuit are operating in their steady state conditions. This method allows a very fast determination of ripple voltages for any circuit settings without the need of storing initial values of inductors and capacitors in the circuits. To demonstrate how this method works we will use the same circuit LMR43620 Multiple Simulations.TSC.
This circuit is identical with the previous circuit, except for some Global Parameter settings. The Global Parameter settings determine the starting time (7ms) of the switching mode transient analysis.
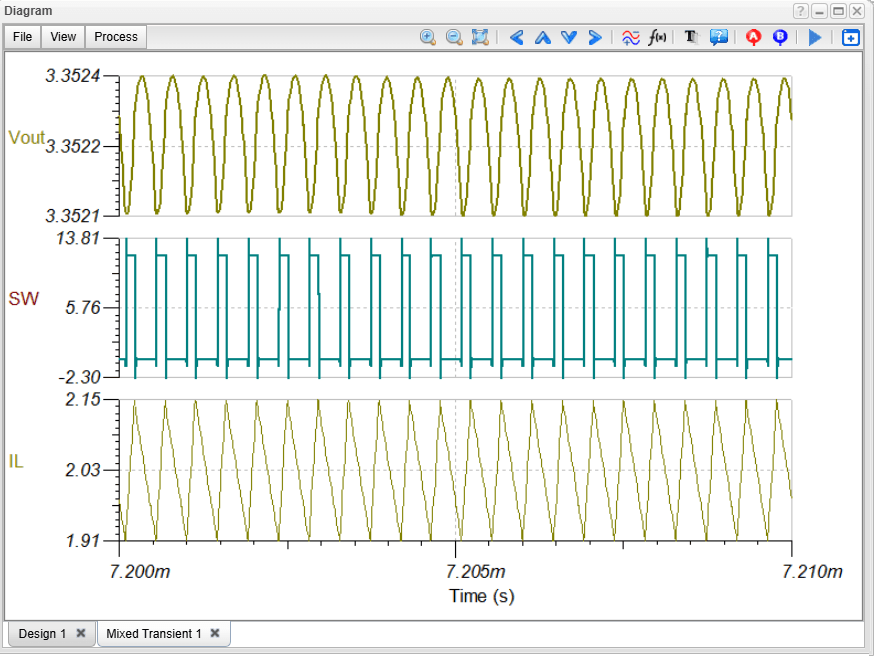
We will use TINACloud to analyze the circuit and determine the ripple voltage.
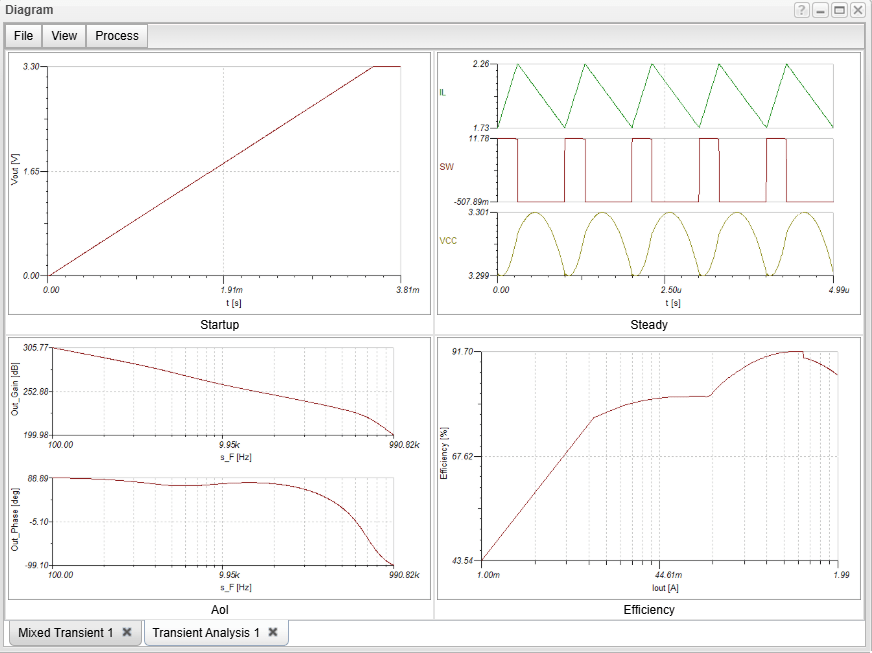
Let’s run Transient analysis. After a short calculation time the ripple voltages and current of the outputs appear in a diagram.
Similarly, you can also quickly simulate Line Stepping and Load Stepping circuit response.
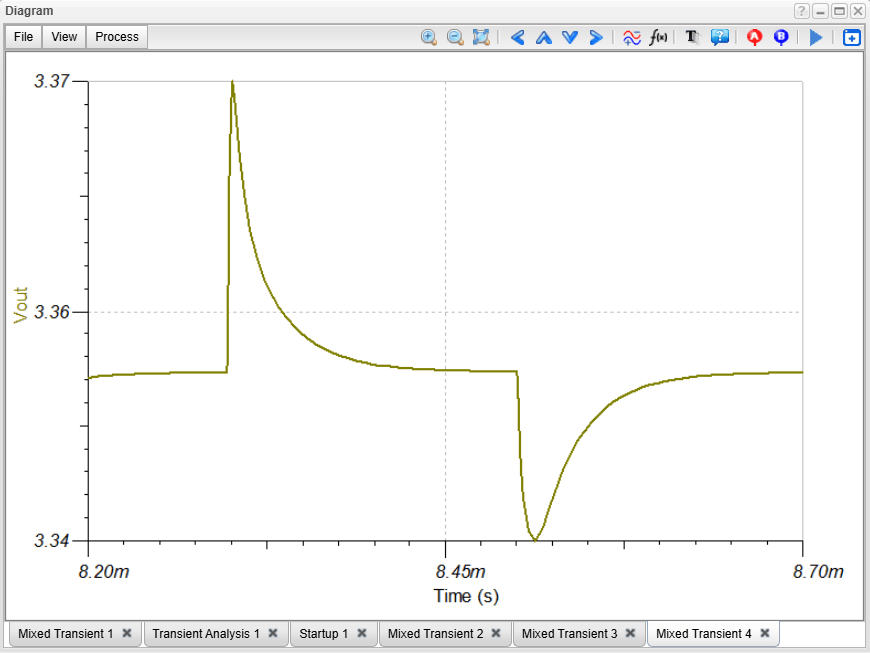
3. Line Stepping Analysis
Line stepping analysis of DC-DC converters is used to determine how a DC-DC converter responds to changes in the input voltage.
TINA and TINACloud can simulate the circuit response extremely fast due to their built-in average models. Line stepping analysis of DC-DC converters is used to determine how a DC-DC converter responds to changes in the input voltage. TINA and TINACloud can simulate the circuit response extremely fast due to their built-in average models.
To see how the circuit responds to a step change in the Input Voltage, click on the link “Line Step Analysis Fast”. In a few seconds, the circuit response will appear in a diagram.
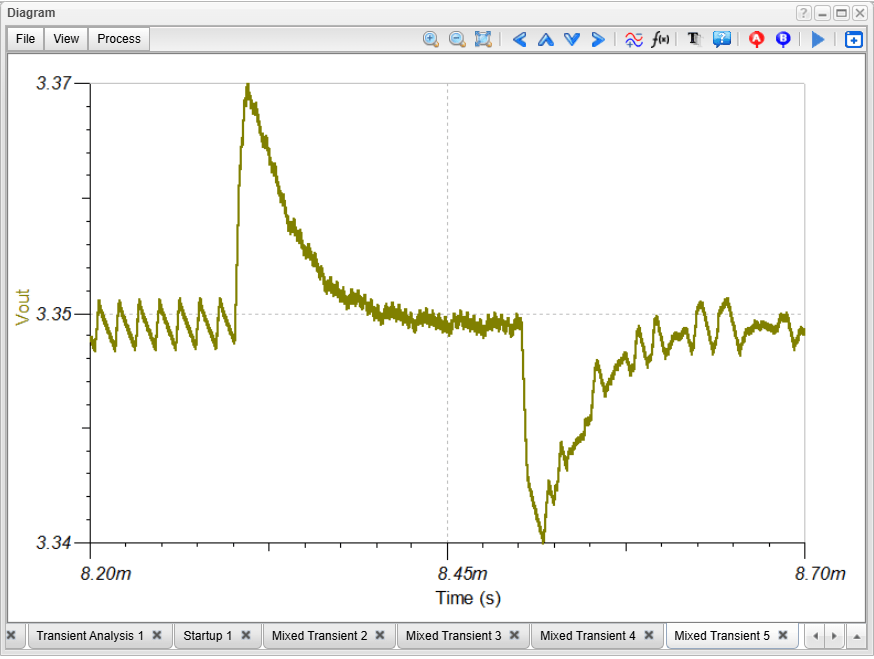
To run the switching model, check the “Use switching model” checkbox in the Run Transient dialog and press run. The full ripple voltage appears:
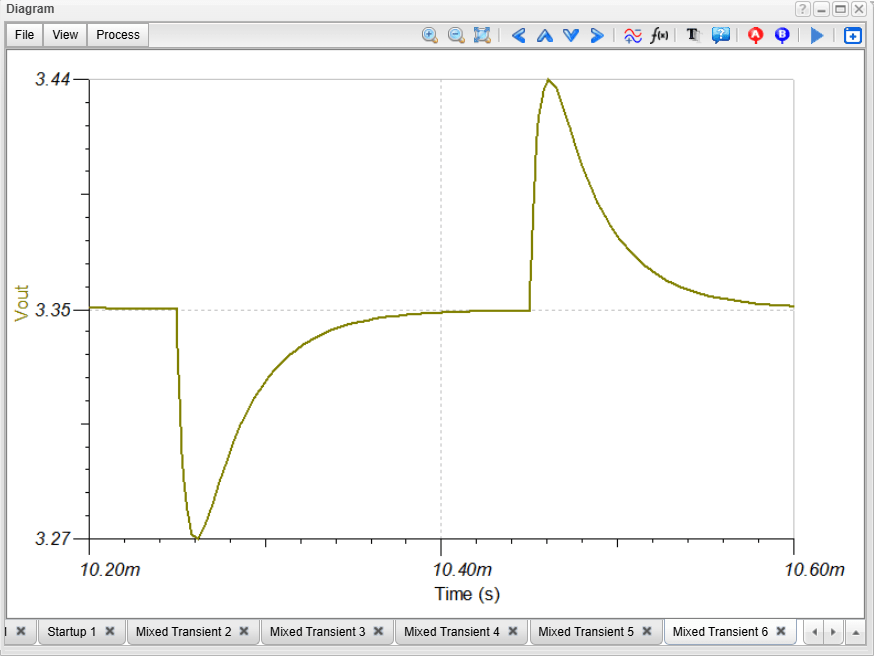
4. Load Step Analysis
Load step analysis of DC-DC converters is a type of circuit simulation that is used to determine how a DC-DC converter responds to changes in the load current. In TINA and TINACloud you can also quickly simulate the circuit response to a load step.
To see how the circuit responds to a step change in the I_step current, click on the link: “Load Step Analysis Fast”. In a few seconds, the circuit response will appear in a diagram.
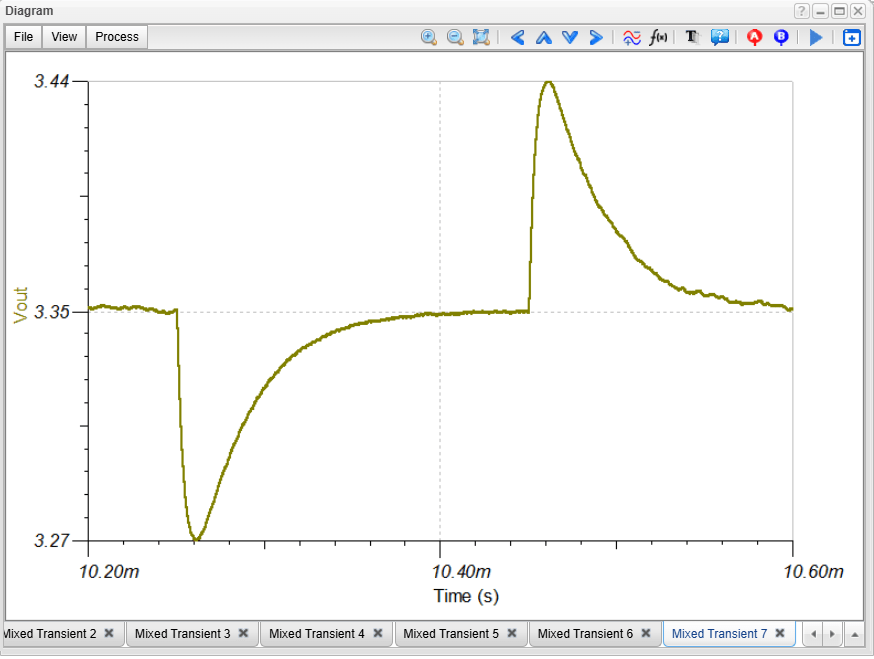
There is also a switching mode version to see the accurate simulation. Check the “Use switching model” checkbox in transient dialog and run the simulation.
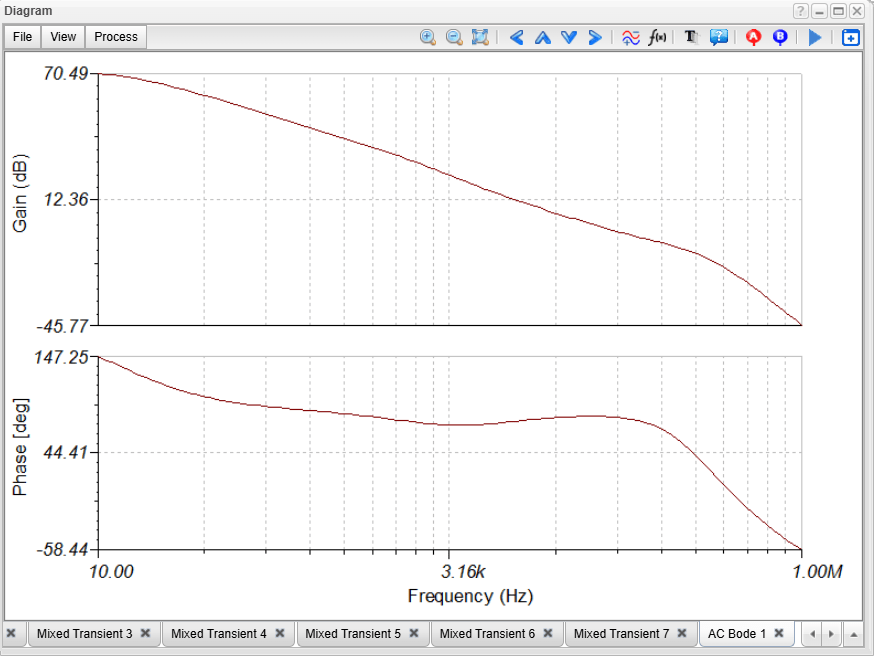
5. AC Analysis
The built-in average models of DC-DC converters in TINA and TINACloud allow fast and accurate AC analysis. Click the AC Transfer Characteristic link or select AC Analysis from the Analysis menu and Run AC Transfer. The AC Bode diagram of the Loop Gain appears.
6. Efficiency Analysis
TINA and TINACloud also allow fast and accurate calculation of efficiency as a function of load current.
The efficiency as functions of time and load current is calculated using a special time-dependent (Iout) load current. For this calculation a dedicated Efficiency Meter is available on the Meters menu of TINA and TINACloud. Click the link “Efficiency Analysis Fast link, or Run Analysis/Transient…
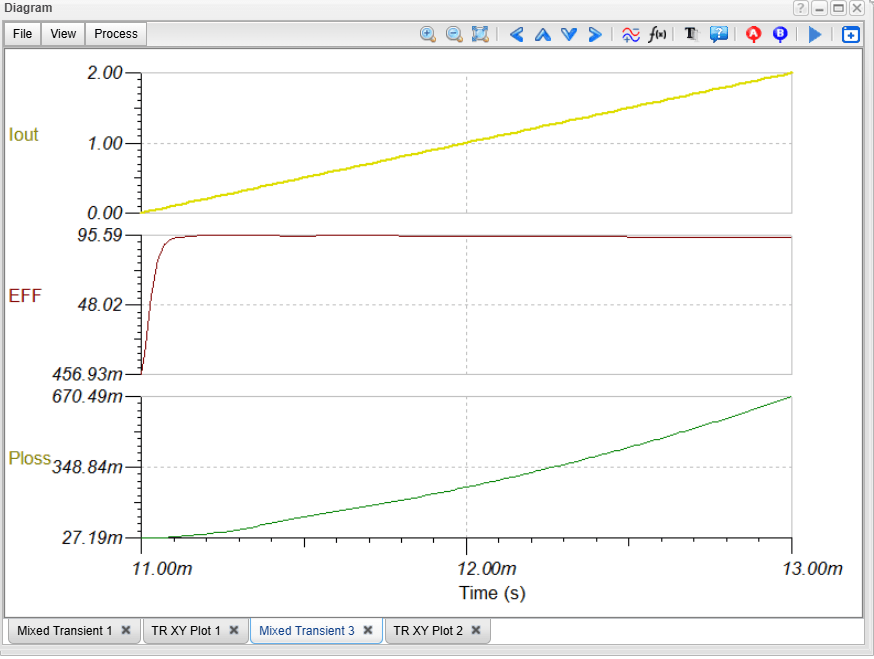
LMR43620 circuit: Efficiency as a function of time
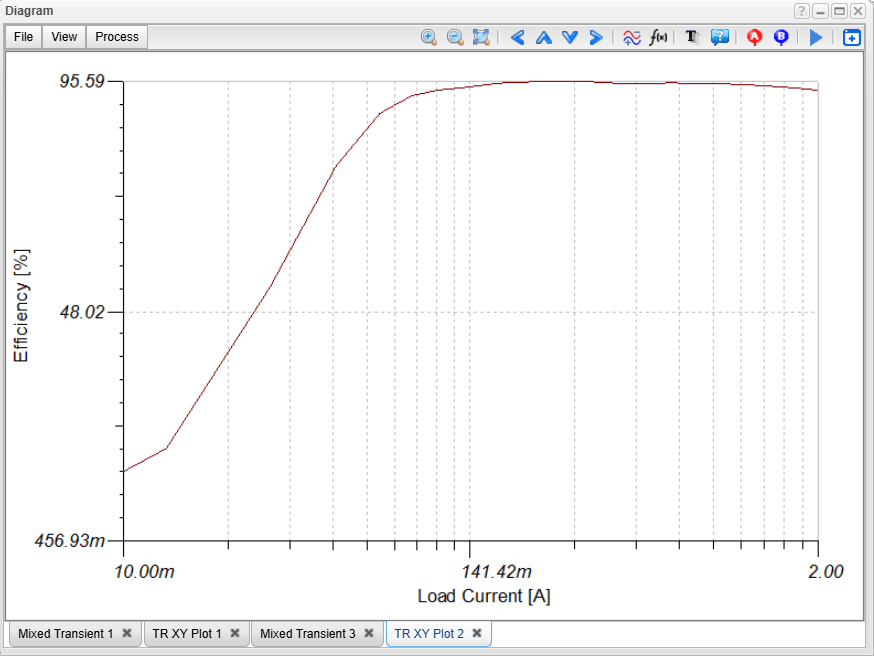
Click the TR XY Plot Tab. The Efficiency as a function of Output or Load current appears:
This concludes the video tutorial on analyzing the key characteristics of the LMR43620 Synchronous Buck Regulator using TINACloud.
You can learn more about TINACloud here: www.tinacloud.com
You can learn more about TINA here: www.tina.com
Explore more content from our channel: https://www.youtube.com/@TinaDesignSuite