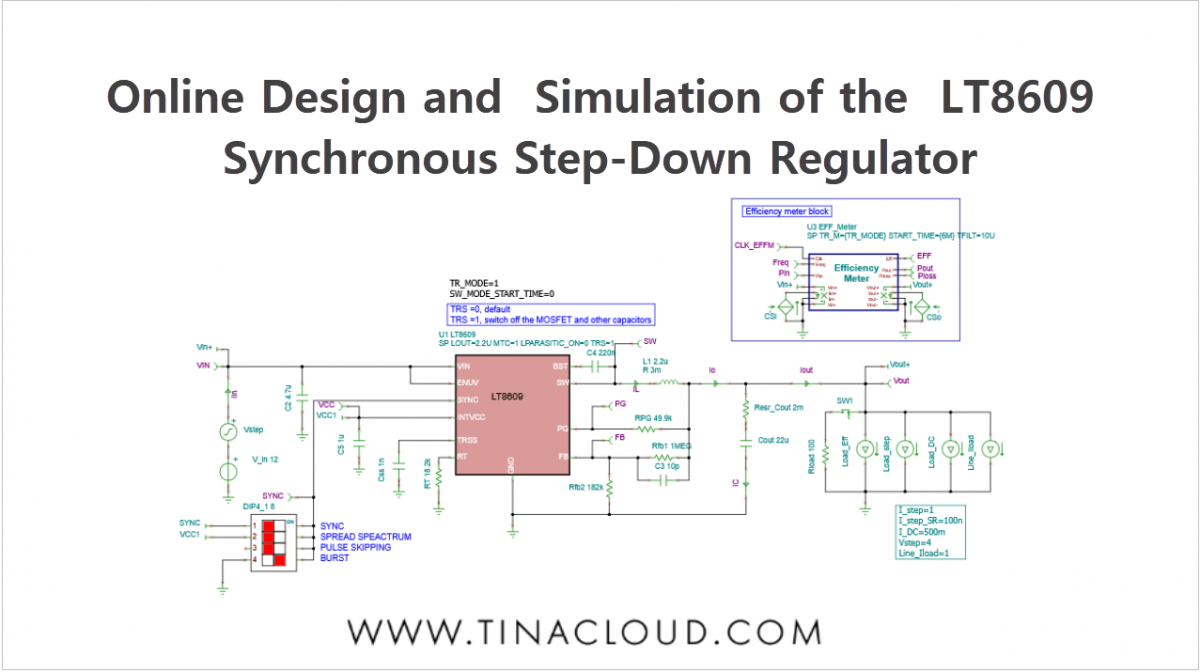
We’ve created a new video tutorial that explores how to quickly and accurately design and simulate power management circuits with TINACloud, this time using the LT8609 synchronous step-down switching regulator as an example. You can also use the offline TINA program for this, which we’ll illustrate in another video. The SPICE model for this device, created by DesignSoft from the official Analog Devices datasheet, is compatible with most major SPICE programs, including TINA, TINACloud, PSpice, SIMetrix, and LTspice.
Here is a summary of the video’s content:
- Startup Transient Analysis
- Output Voltage Ripple
- Line and Load Step Analysis
- AC Analysis
- Efficiency Analysis
1. Startup Transient Analysis
A startup transient is the period a DC-DC converter takes to transition from an off state to its steady-state operating condition. Typically, simulating this can be time-consuming. However, TINA and TINACloud’s built-in average model significantly speeds up the process, taking only a few seconds. For more detailed results, the software can also perform a switching mode transient analysis, which is still quite fast thanks to its advanced multi-core solvers. Additionally, TINA and TINACloud can quickly calculate ripple voltages by combining the average and switching models.
To begin, we’ll open the “LT8609 Multiple Simulations.TSC” circuit file. This single file allows you to run all the necessary simulations to characterize the LT8609.
Running a Simulation
To perform a fast transient analysis using the average model, click the Transient Analysis Fast link or select Transient… from the Analysis menu. By default, the “Use switching model” checkbox is unchecked, which ensures the fast average model is used. After you click Run, the startup transient’s time function will appear in seconds, showing an output voltage of approximately 5V.
Redesigning the Circuit
TINA and TINACloud’s Design Tool can automatically adjust circuit parameters to meet a new output voltage target. Let’s change the output voltage from 5V to 3.3V. Select Re-design this circuit from the Tools menu or double-click the text box on the circuit. In the dialog, simply change Vout to 3.3V and click Run. The Design Tool will automatically adjust components like the Rfb2 and Rload resistors to achieve the new output, providing an immediate diagram based on these changes. You can then run a more accurate numerical simulation to confirm the new voltage.
You can also run a more accurate simulation using the switching model. Just select the Transient Analysis Accurate link or check the “Use switching model” checkbox. This calculation takes longer (about a minute) but provides more detailed waveforms, including the ripple that the average model doesn’t show.
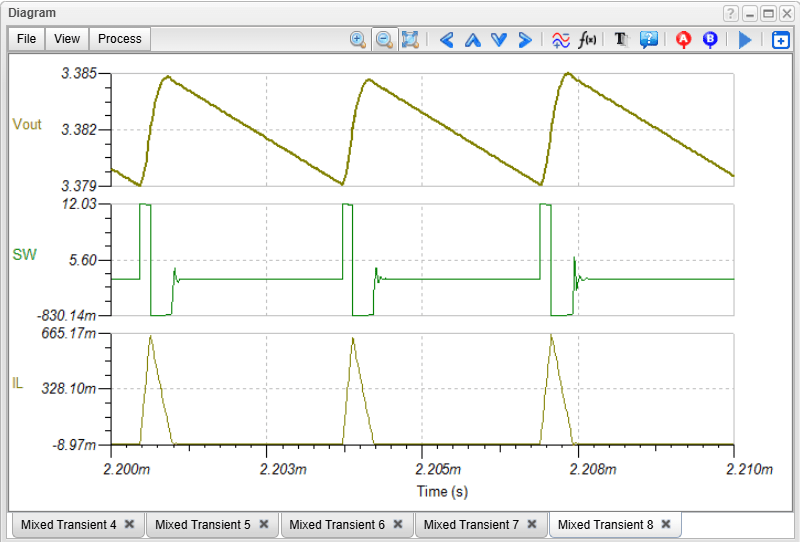
2. Steady State and Ripple Voltage Analysis
Steady-state analysis examines a circuit’s behavior once all transients have settled. This is crucial for quickly determining ripple voltages. This method is particularly fast because it doesn’t require storing initial inductor and capacitor values. Using the same circuit file, let’s perform a transient analysis to see the ripple voltages and currents. A diagram of these values will appear after a brief calculation.
TINA and TINACloud can also quickly simulate how a DC-DC converter responds to sudden changes in either input voltage or load current. These are known as line stepping and load stepping, respectively.
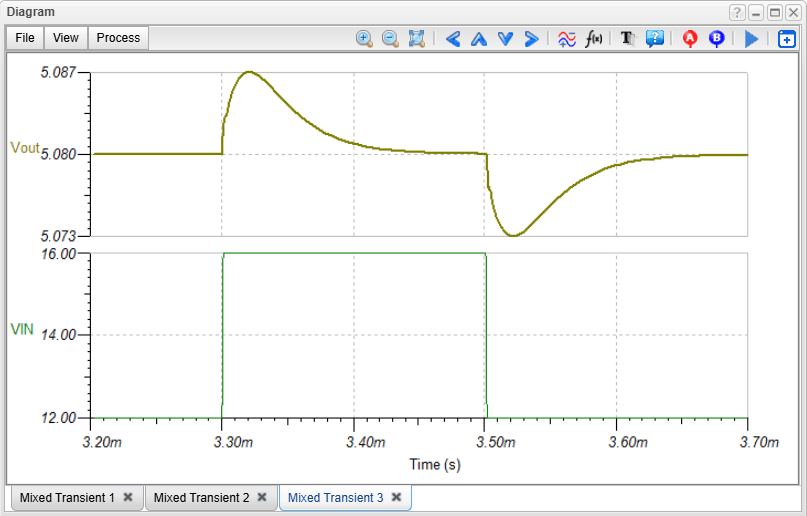
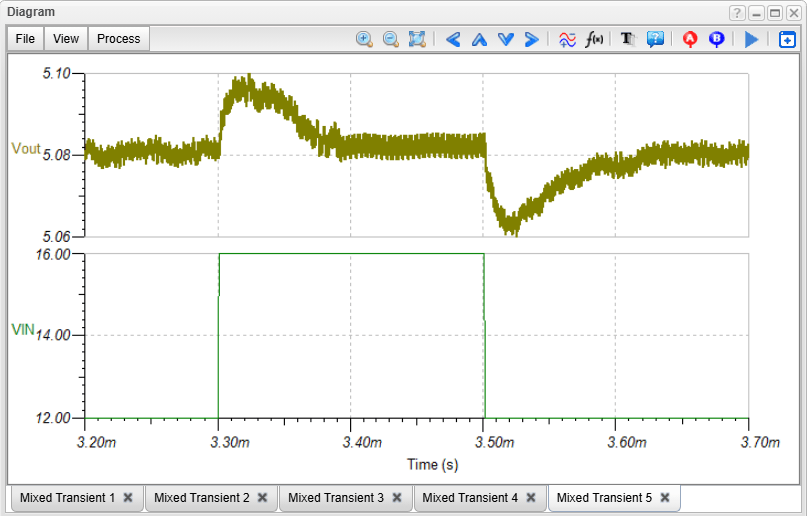
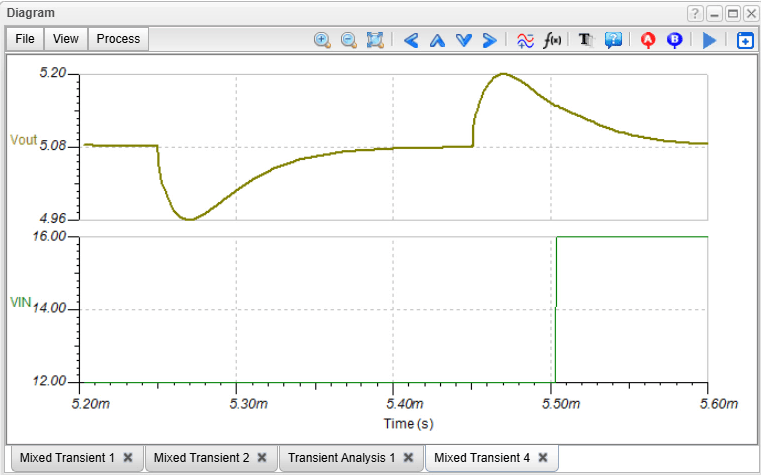
3. Line Step Analysis
To see how the circuit responds to an input voltage change, click the “Line Step Analysis Fast” link. Within a few seconds, a diagram of the circuit’s response, including the full ripple voltage, will appear.
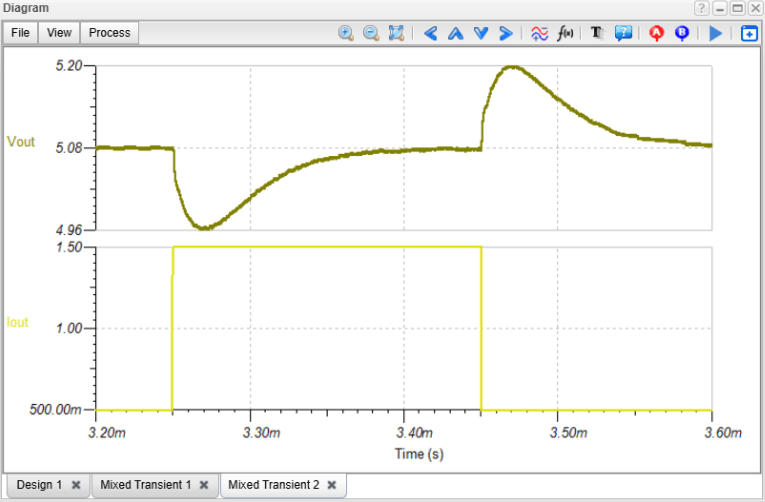
4. Load Step Analysis
Similarly, to see the circuit’s response to a load current change, click the “Load Step Analysis Fast” link. The diagram will appear almost instantly. You can also run a more accurate, switching-mode version of this analysis by checking the “Use switching model” box in the transient dialog.
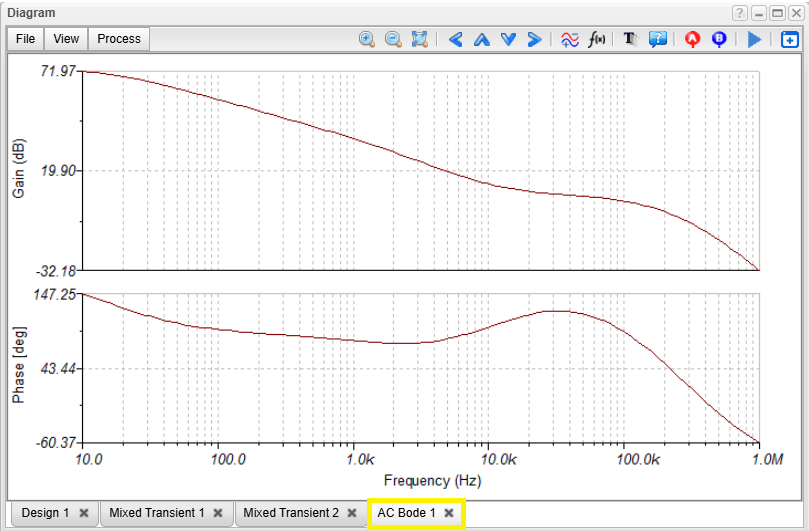
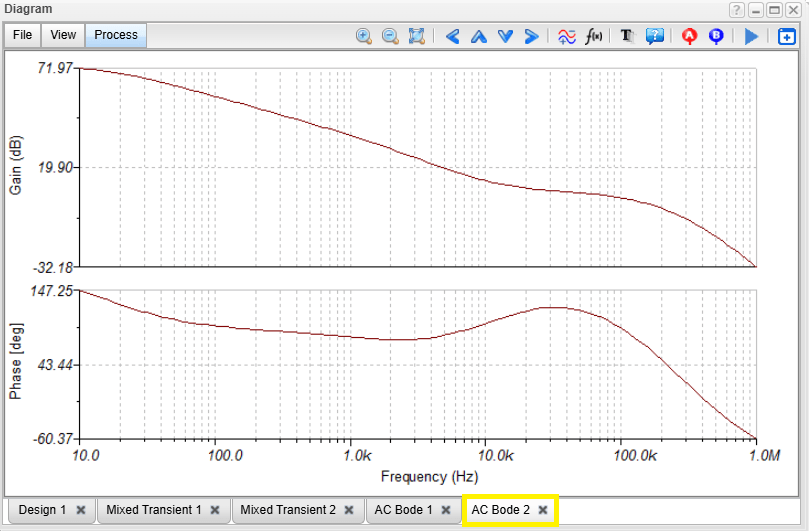
5. AC Analysis
The built-in average models also enable fast and accurate AC analysis. Simply click the AC Transfer Characteristic link or select AC Analysis from the menu. This will display the AC Bode diagram of the loop gain.
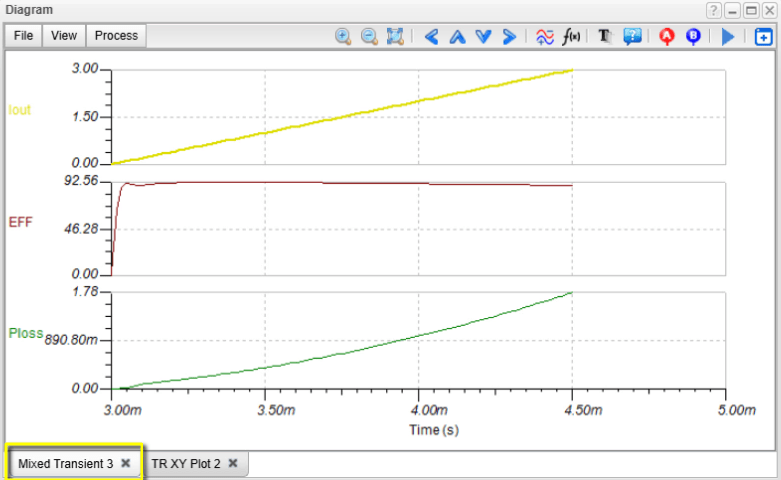
6. Efficiency Analysis
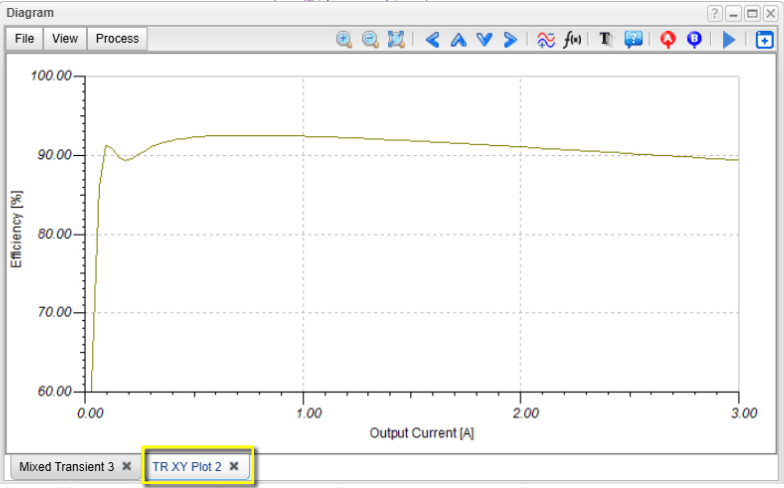
Additionally, TINA and TINACloud can quickly calculate and plot efficiency as a function of time and load current. By clicking the “Efficiency Analysis Fast” link, you can get a diagram showing efficiency versus time. By switching to the TR XY Plot Tab, you can also view efficiency as a function of output or load current.
Conclusion
TINA and TINACloud provide a comprehensive and efficient platform for analyzing all the key characteristics of a synchronous step-down regulator like the LT8609. Its built-in average models and advanced solvers make it easy to quickly get accurate results for various analyses, including transient, ripple, line/load step, AC, and efficiency.
Click here to watch our video.
You can learn more about TINACloud here: www.tinacloud.com
You can learn more about TINA here: www.tina.com