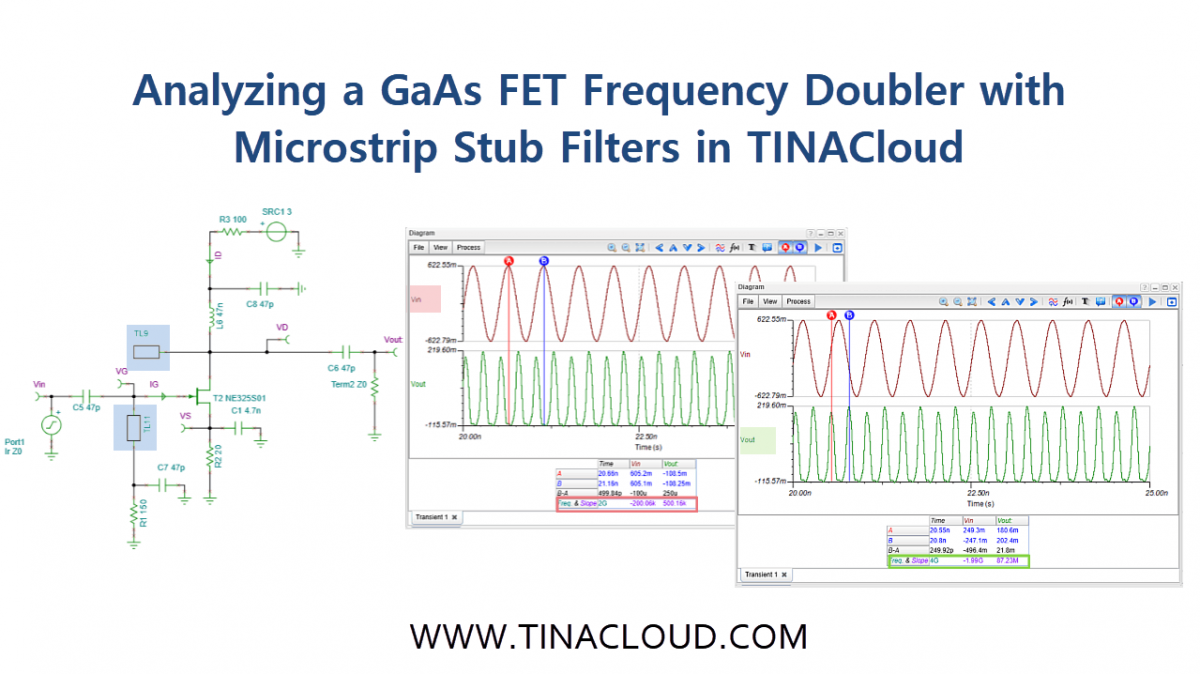
In our latest video, we demonstrate the application of the Harmonic Balance (HB) method in TINACloud by analyzing a frequency doubler circuit that uses a GaAs FET transistor and microstrip stub filters to optimize circuit operation.
In TINA v16, TINACloud and later versions, you can analyze nonlinear RF and Microwave circuits using the Harmonic Balance analysis method.
The advantage of this approach is that it does not require detailed time-domain simulation, which can be prohibitive for GHz-range signals.
Instead, you simply specify the desired base harmonics, and the program calculates and displays the resulting spectrum lines.
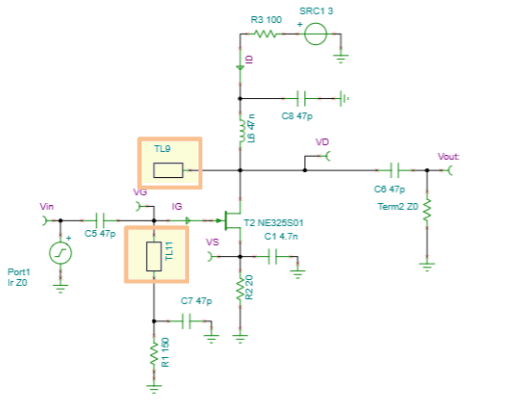
GaAs FET Frequency Doubler circuit
Open the Frequency Doubler GasFET file from the TINA Examples\RF\HB folder.
This frequency doubler circuit generates a 4 GHz output signal, exactly two times the2 GHz input frequency, using a high frequency GaAs FET transistor.
Besides the GaAs FET transistor, the circuit contains two other parts of interest.
A short-circuited half-wavelength stub (λ/2, λ, 3λ/2, …), TL11, is connected to the gate of the FET. It exhibits resonant frequencies at 4 GHz and integer multiples, thereby suppressing the 4 GHz component and its harmonics at the gate.
In addition, a second open-circuited quarter-wavelength stub (λ/4, 3λ/4, …), TL9, is connected to the drain of the FET. It exhibits resonant frequencies at 2 GHz and its odd multiples, thereby filtering out the 2 GHz fundamental frequency component from the output signal.
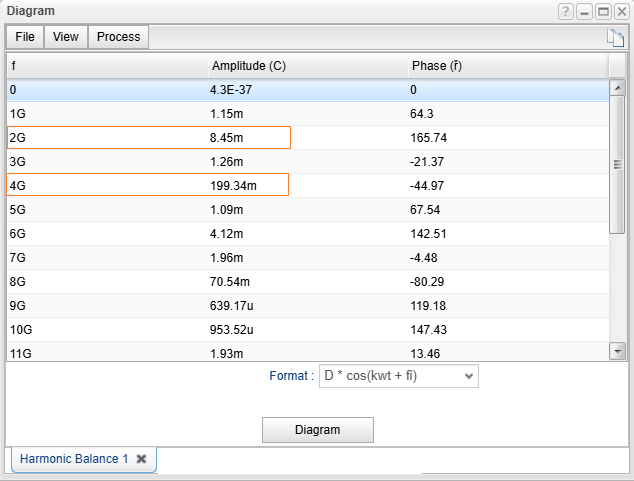
Running the Harmonic Balance Analysis
To observe the output spectrum, navigate to the Analysis menu and select Harmonic Balance Analysis. Use the following parameters:
- Base frequency: 1 GHz
- Number of harmonics: 20
- Output: Vout
The analysis results clearly demonstrate the circuit’s effectiveness. The dominant spectral component appears at 4 GHz (the second harmonic) with an amplitude of 199.34 mV. Meanwhile, the fundamental 2 GHz component is suppressed to a mere 8.45 mV, confirming successful frequency doubling.
Verification: Transient and Fourier Analysis
TINACloud allows you to validate your HB results using traditional time-domain methods.
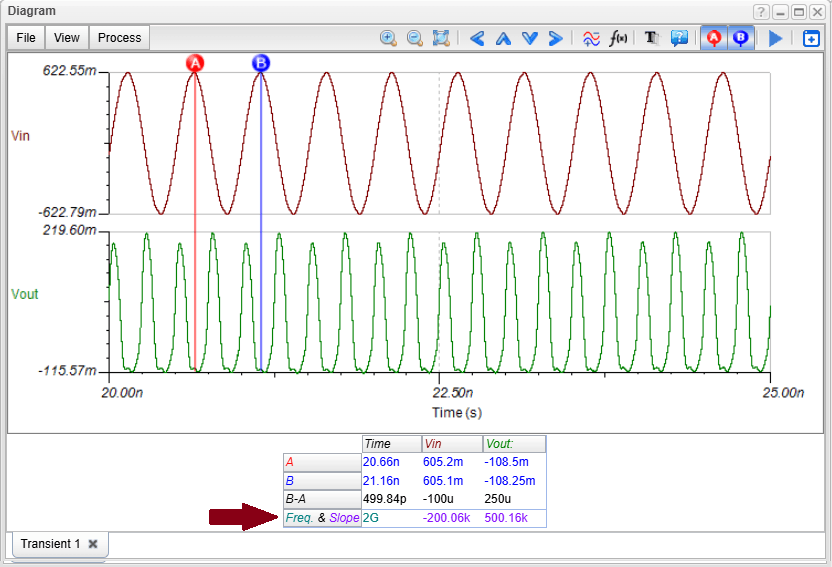
1. Transient Analysis
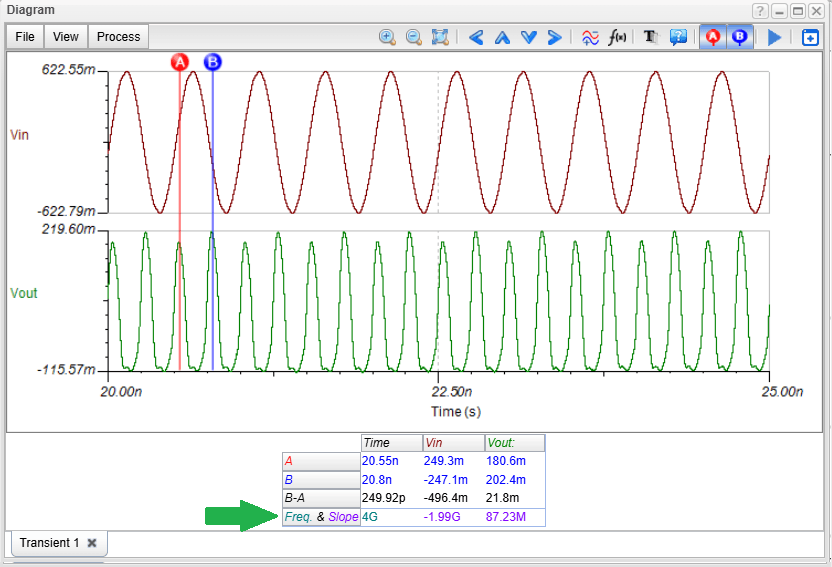
When you run a Transient Analysis, the waveform visually confirms the doubling effect: the output period is half that of the input. By placing cursors on the curves, the Diagram Window confirms the frequencies:
- Vin: 2 GHz
- Vout: 4 GHz
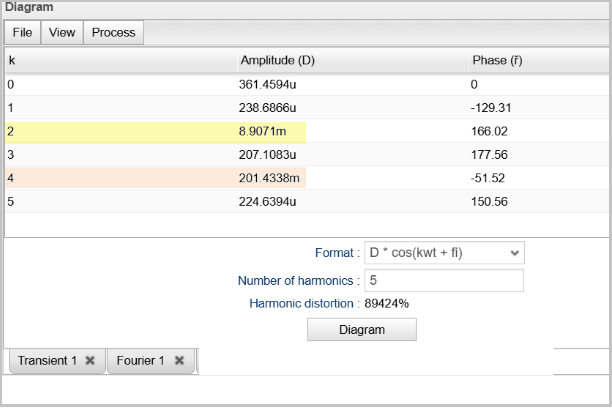
2. Fourier Series Analysis
For a final numeric check, we can convert the transient data into the frequency domain. Run Fourier Series Analysis with these settings:
- Sampling Start time: 200 ns (to ensure the circuit has reached a steady state)
- Base frequency: 1 GHz
- Number of samples: 4096
The resulting Fourier amplitudes and phases show excellent agreement with the Harmonic Balance data, providing total confidence in the design.
Conclusion
The combination of GaAs FET technology and Microstrip Stub Filters creates a robust frequency doubler, and TINACloud’s Harmonic Balance engine provides a streamlined alternative to traditional time-domain methods. By avoiding the overhead of long time-domain simulations, you can iterate faster and refine your microwave designs with ease.