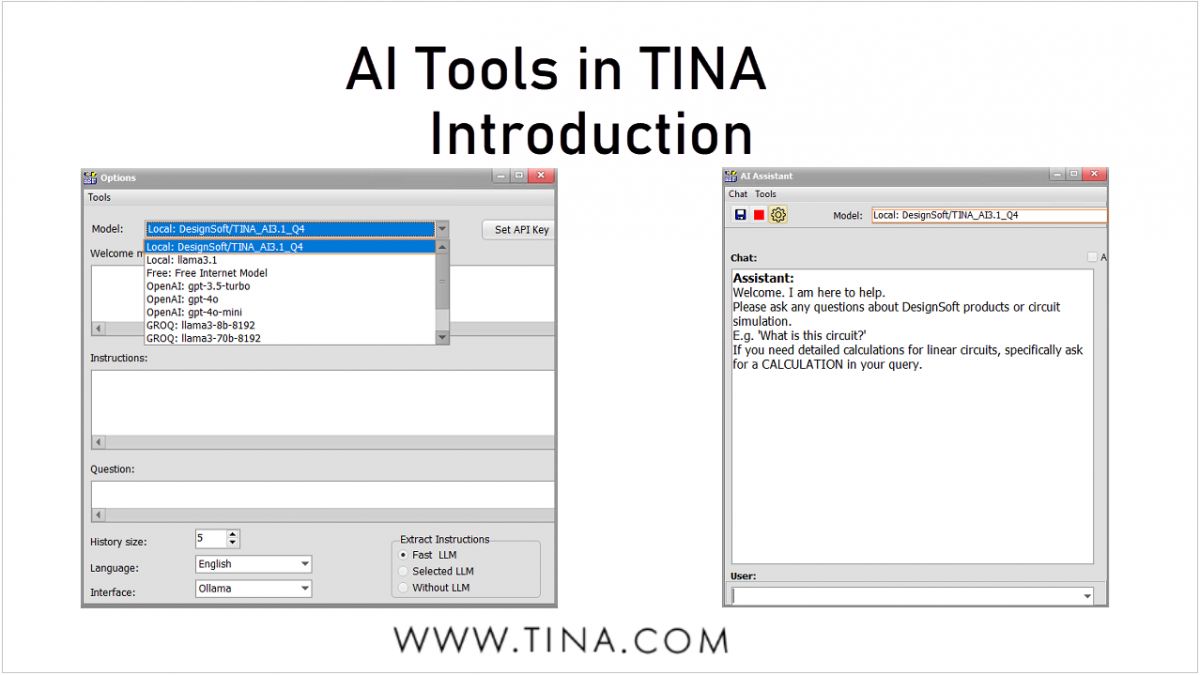
Introduction
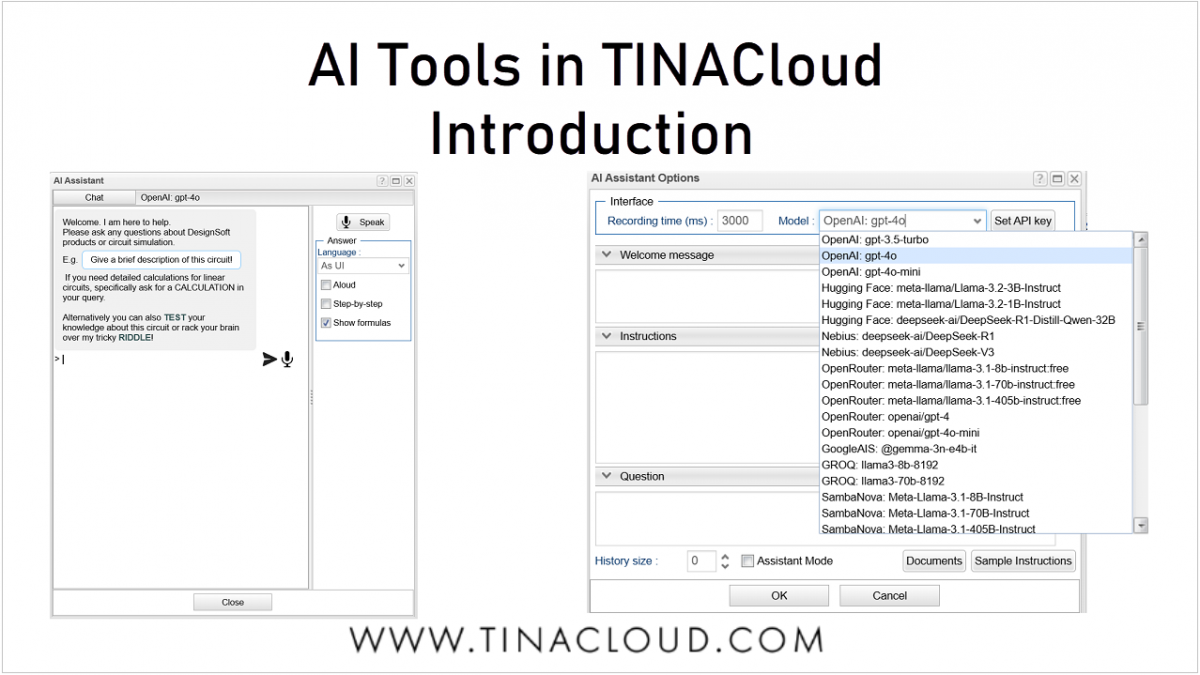
AI tools in TINA and TINACloud offer a flexible, user-friendly interface for various engineering tasks, including circuit design, simulation, code generation, and education such as:
- Providing information on circuits
- Designing LDO and SMPS power supply circuits
- Designing active and passive filters
- Designing analog oscillators and digital clock generators
- Selecting and redesigning evaluation circuits from different manufacturers
- Generating Arduino code for rapid prototyping
- Image recognition with Python or MCU
- Creating step-by-step solution of simple DC/AC circuits
- Creating quizzes and riddles and check their solution
Our video summarizes the key general information for using the AI tools in TINA.
Circuit Design, Code Generation and AI-controlled Image Recognition
This video will cover the following:
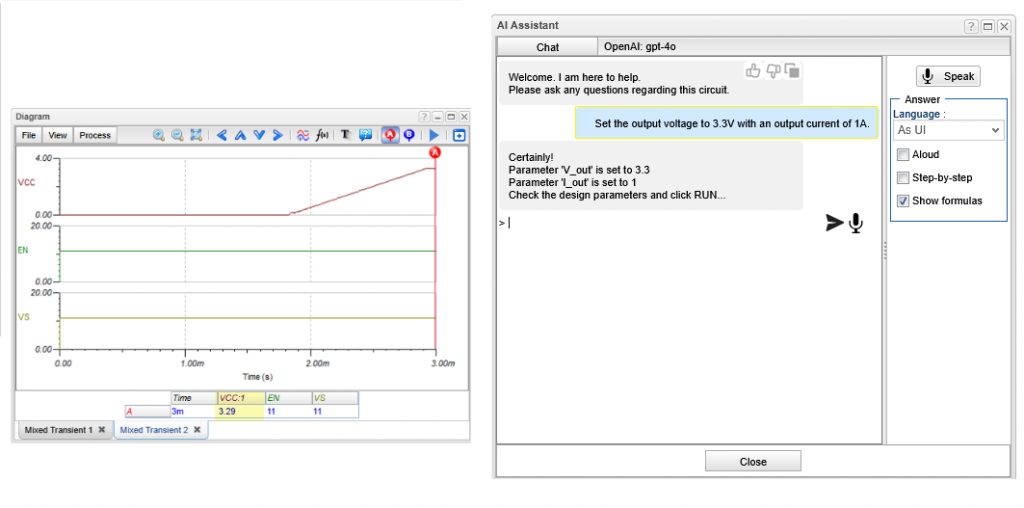
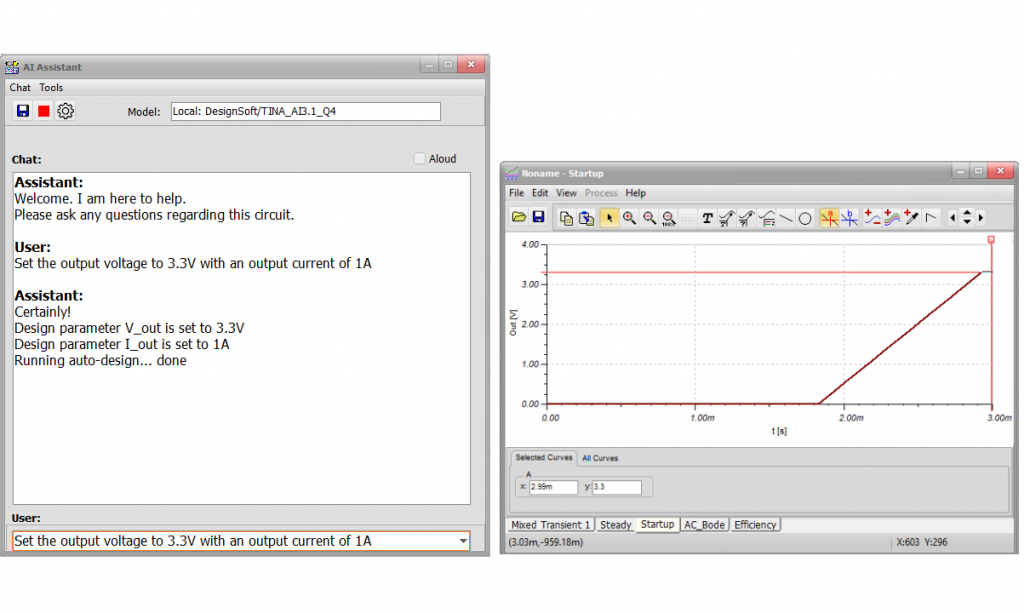
Redesigning a Switch Mode Power Supply circuit
First, we will redesign a switch-mode power supply circuit by altering its output voltage, using AI to achieve this. The AI Assistant will utilize the Design Tool to automatically calculate and adjust the necessary component values. We will then run a Transient Analysis to verify the result.
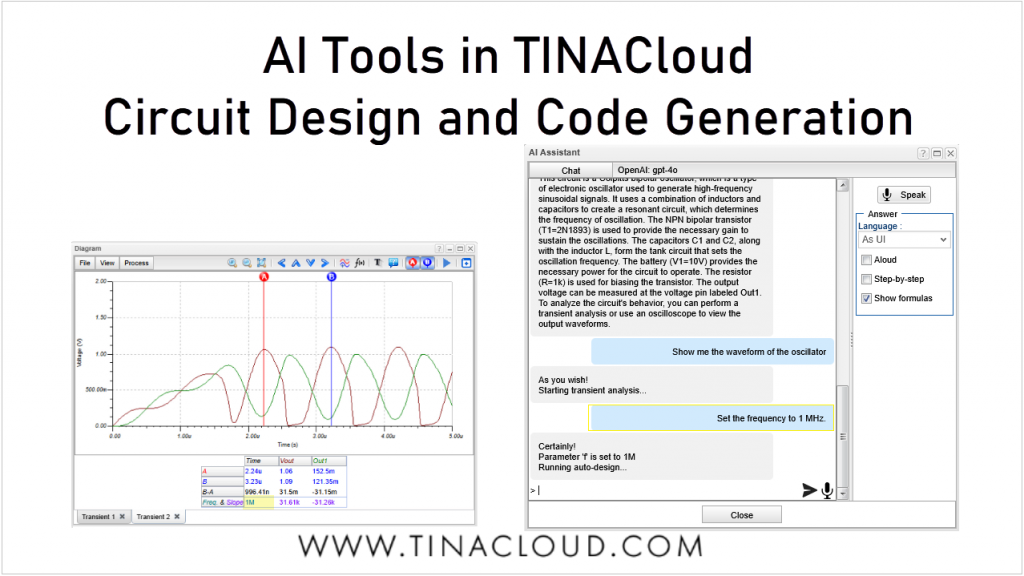
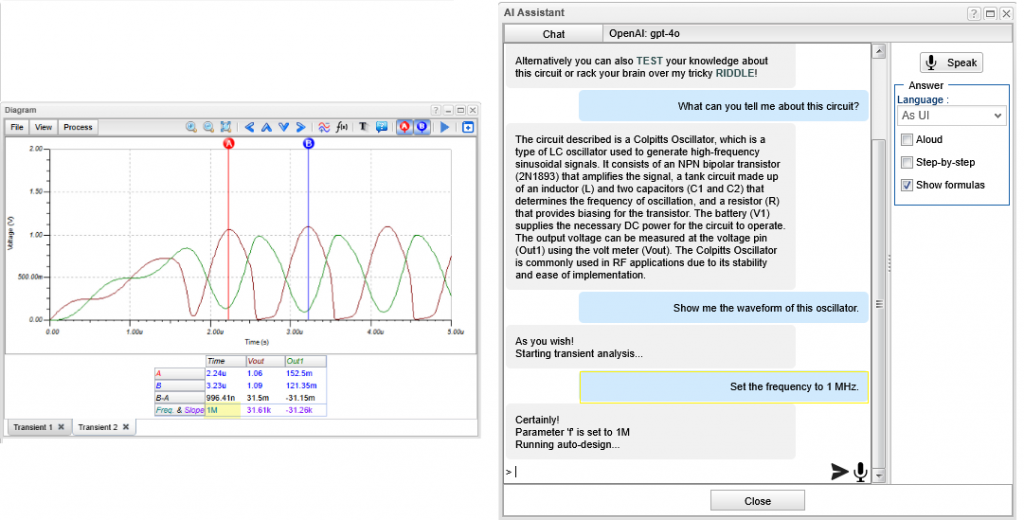
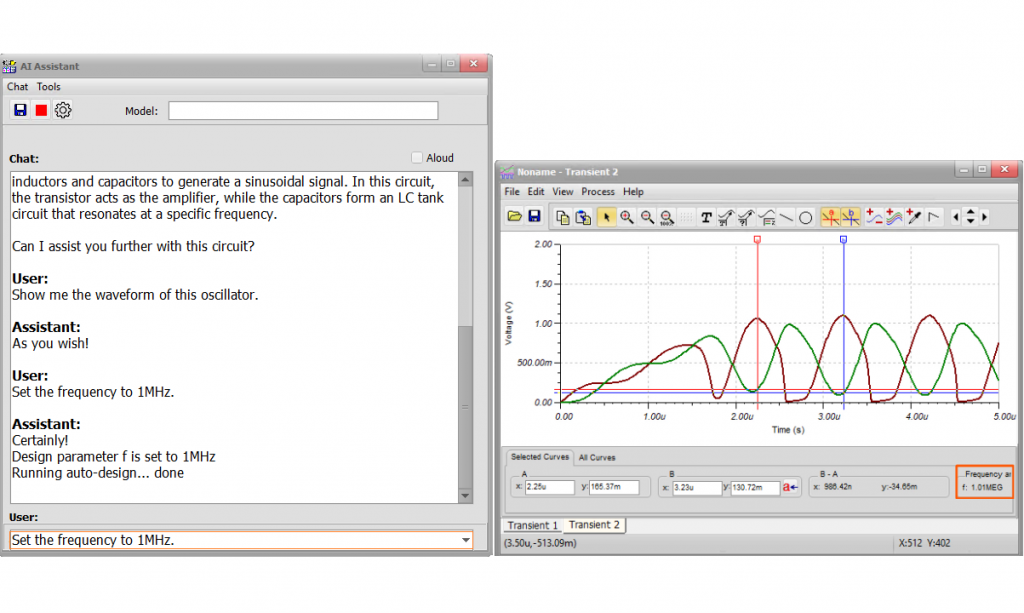
Redesigning a Colpitts Oscillator circuit and Providing Information
Next, we will redesign a Colpitts Oscillator circuit. We will instruct the AI to modify the oscillator circuit’s frequency, and subsequently, we’ll verify the waveform by running a Transient Analysis.
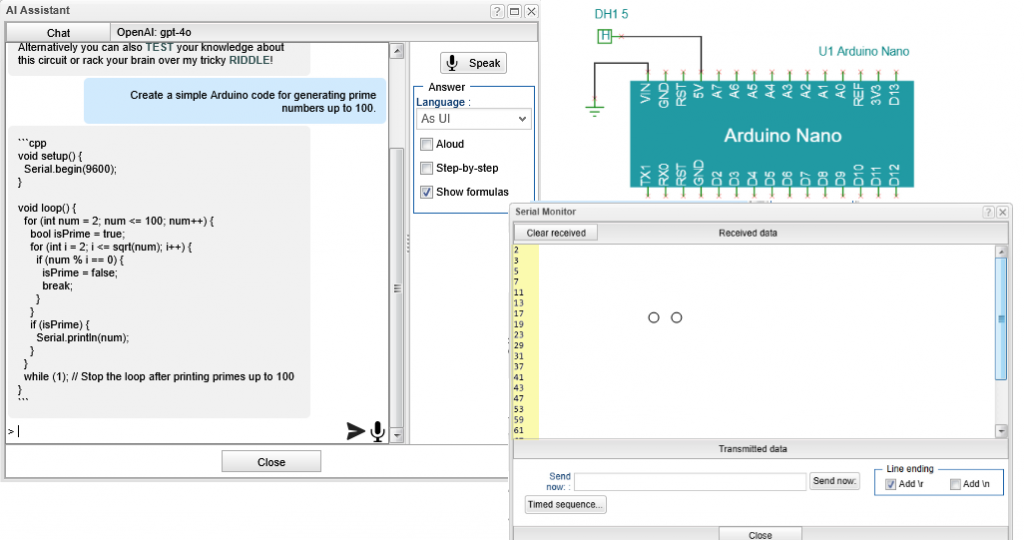
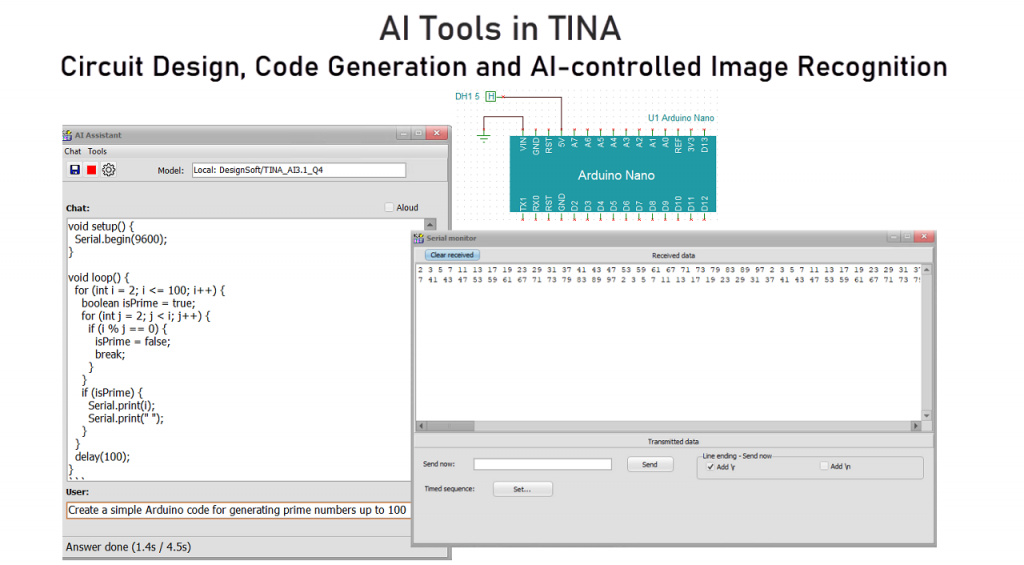
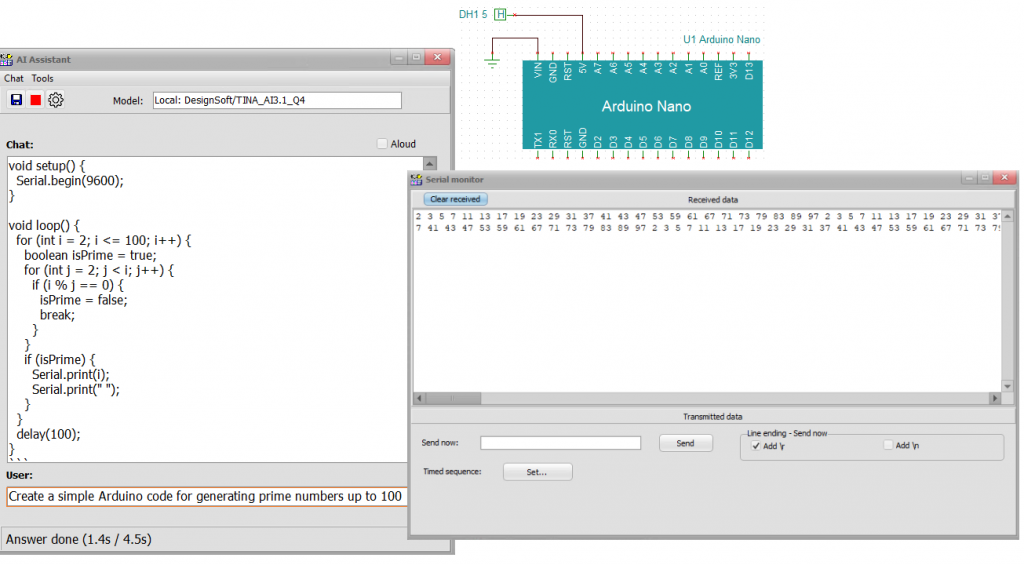
Generating Arduino code for rapid prototyping with AI in TINA
In our third example, we’ll ask the AI to generate a simple Arduino code for prime numbers up to 100. We will then demonstrate, step-by-step, how to input the AI-generated code into an Arduino Nano board and utilize TINA’s Serial Monitor Tool.”
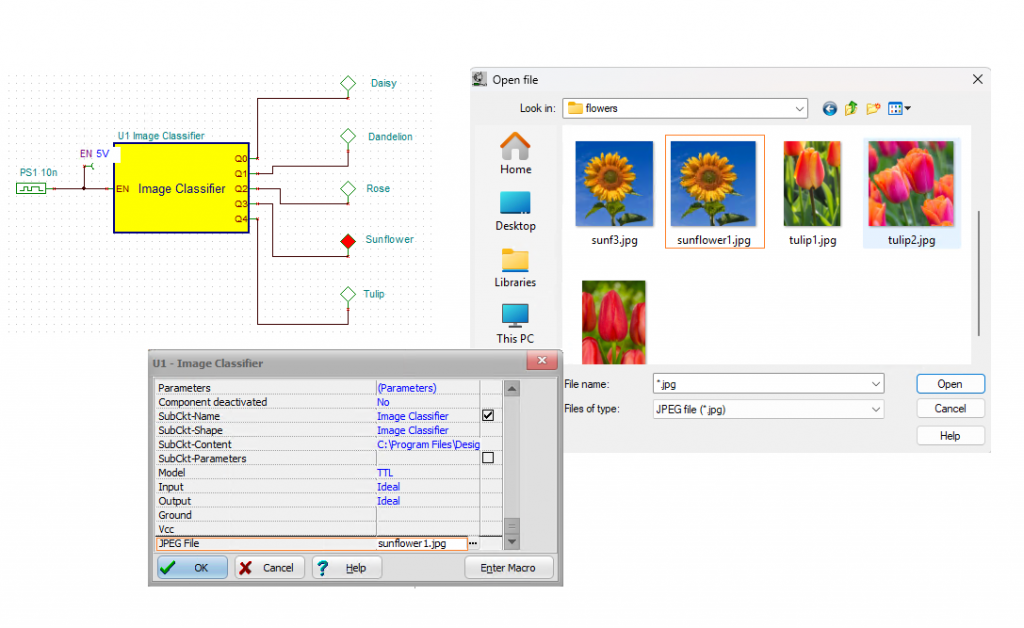
AI-controlled image recognition in TINA
Finally, we’ll explore AI-controlled image recognition using TINA.
We’ll demonstrate how the circuit in this example can recognize five different flowers (Daisy, Dandelion, Rose, Sunflower, and Tulip) from a JPEG picture. Our first step involves using the AI image recognition by Python.TSC file from TINA Examples’ AI folder. You’ll simply press the TR button on the top toolbar to initiate the image recognition. We’ll also cover how to swap out the input image. To conclude, we’ll download an image directly from the internet and show the seamless image recognition process by pressing the TR button.
AI image recognition with TINA
Click here to watch our video.
You can learn more about TINA here: www.tina.com
You can learn more about TINACloud here: www.tinacloud.com