
If you are looking for a quick, reliable way to bring your existing Multisim workflows into the cloud, you are in the right place. In this post, we will demonstrate how to seamlessly convert analog circuit files originally created in offline Multisim formats (such as .ms13 and .ms14) and run them directly inside TINACloud.
💡 Good to Know: This exact conversion process is also available in the offline desktop version of TINA. Because the resulting
.TSCfiles are fully cross-compatible, you can enjoy a frictionless workflow between your local desktop and the online cloud environment.
Click here or on the image above to watch this blog presented as a video tutorial.
Let’s dive into four practical examples to show you exactly how it works.
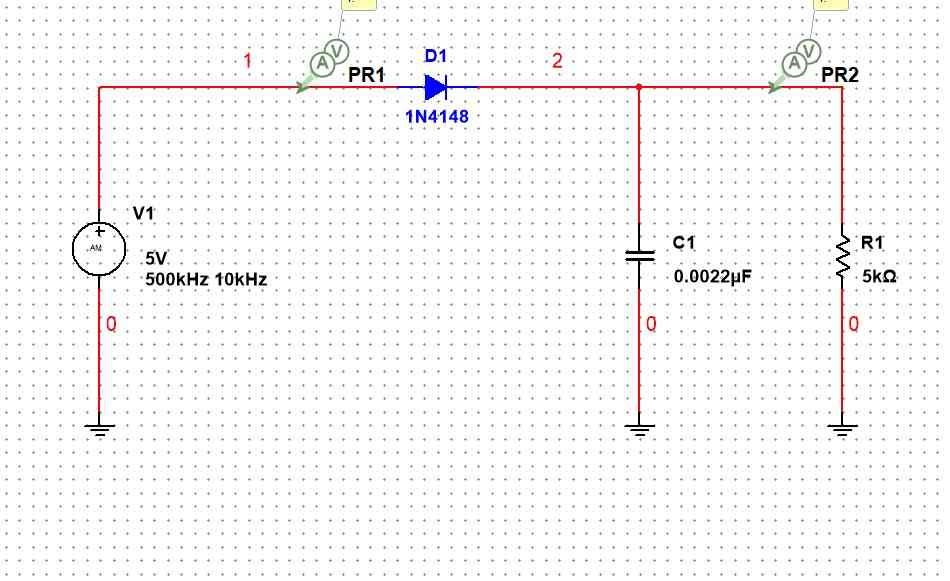
Example 1: AM Demodulator Circuit
Our first example features an Amplitude Modulation (AM) Demodulator circuit designed to process a modulated signal with a 500 kHz carrier and a 10 kHz modulating frequency.
Step 1: Exporting from Multisim
Before heading to the cloud, open your circuit in Multisim. Navigate to the File menu and save the circuit file to your local hard drive.
Step 2: Importing to TINACloud
Switch over to TINACloud and click the Upload command. Select your saved .ms14 file to initiate the automatic conversion. In just a few moments, your fully converted schematic will populate the TINACloud editor workspace.
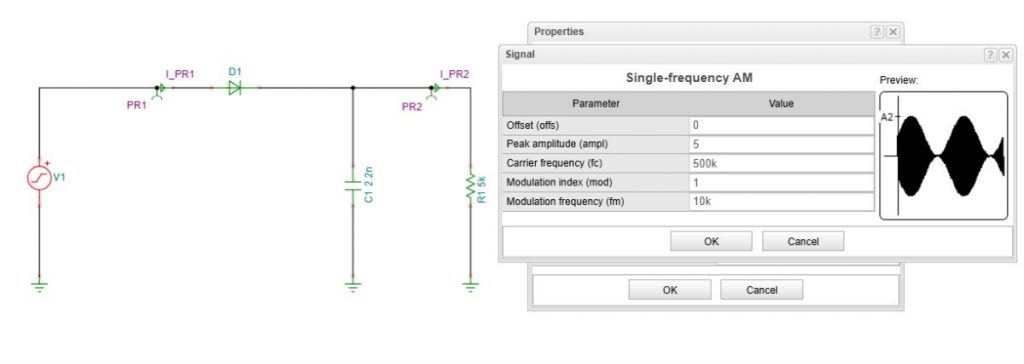
Step 3: Verifying Signal Parameters
To double-check that your inputs carried over correctly, double-click the AM signal generator component. Click the “…” (Details) button on the right side of the Signal line to view and verify the specific parameters of your modulated waveform.
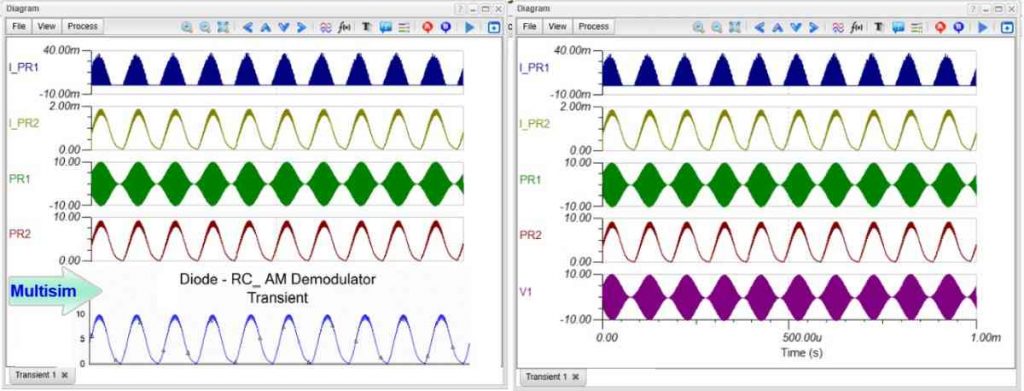
Step 4: Running the Simulation
With everything verified, go to the analysis menu and select Transient Analysis. Once the simulation finishes running, you will see the resulting waveforms on your screen, confirming that the circuit behaves identically to its original Multisim environment.
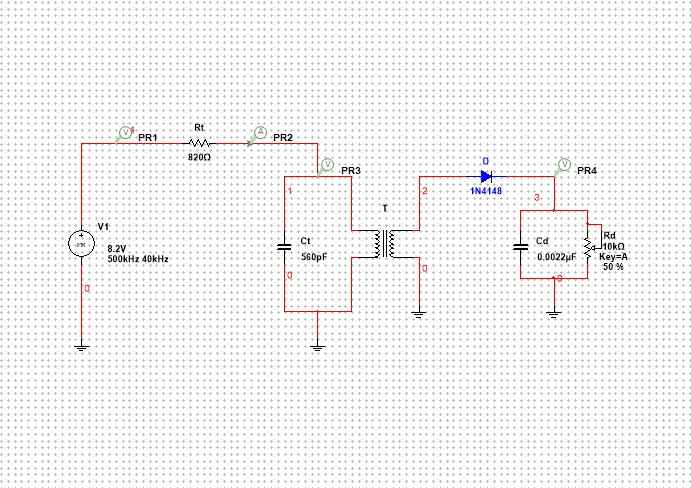
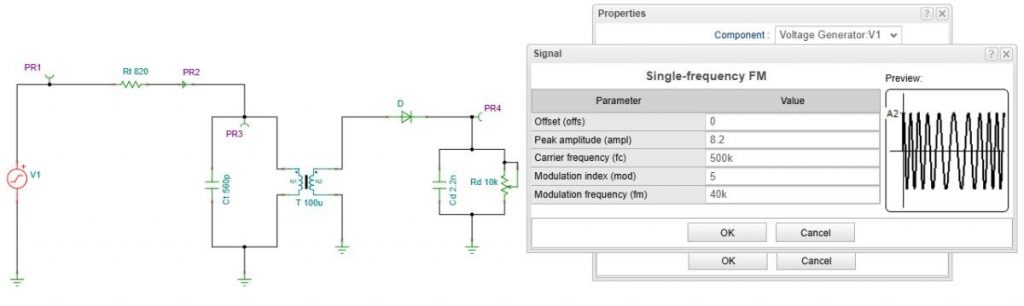
Example 2: FM Demodulation Circuit
Next up is a Frequency Modulation (FM) Demodulation circuit, configured to handle a 500 kHz carrier signal with a 40 kHz modulating frequency.
The Conversion Process
Just like before, save your Multisim file locally (your Downloads folder is a quick, accessible choice). In TINACloud, click Upload, select your file, and watch the platform instantly generate the web-ready schematic.
Waveform Organization & Customization
First, inspect your signal generator parameters to ensure the frequencies are accurate.
To double-check that your inputs carried over correctly, double-click the FM signal generator component. Click the “…” (Details) button on the right side of the Signal line to view and verify the specific parameters of your modulated waveform.
To make the final graph easier to interpret, we can manipulate how the traces display. Open the properties for the output probe PR4 and add :1 to the label name (changing it to PR4:1). This tiny syntax trick tells TINACloud to isolate this specific trace and move it directly to the top position of your diagram.
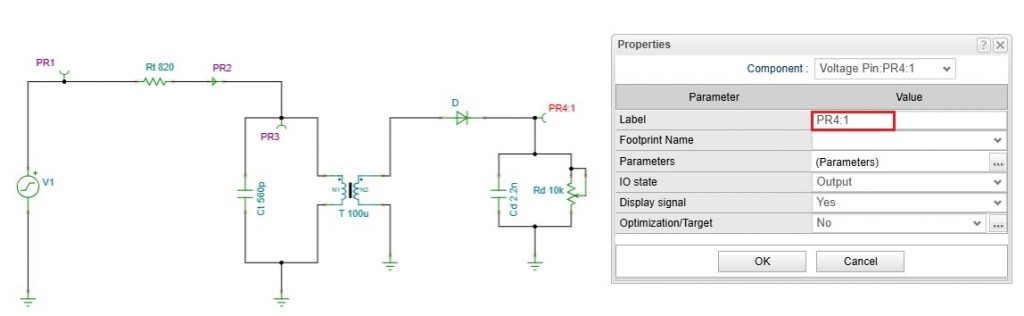
FM Demodulation Circuit in TINACloud – Adding “:1” to PR4
Running the Analysis
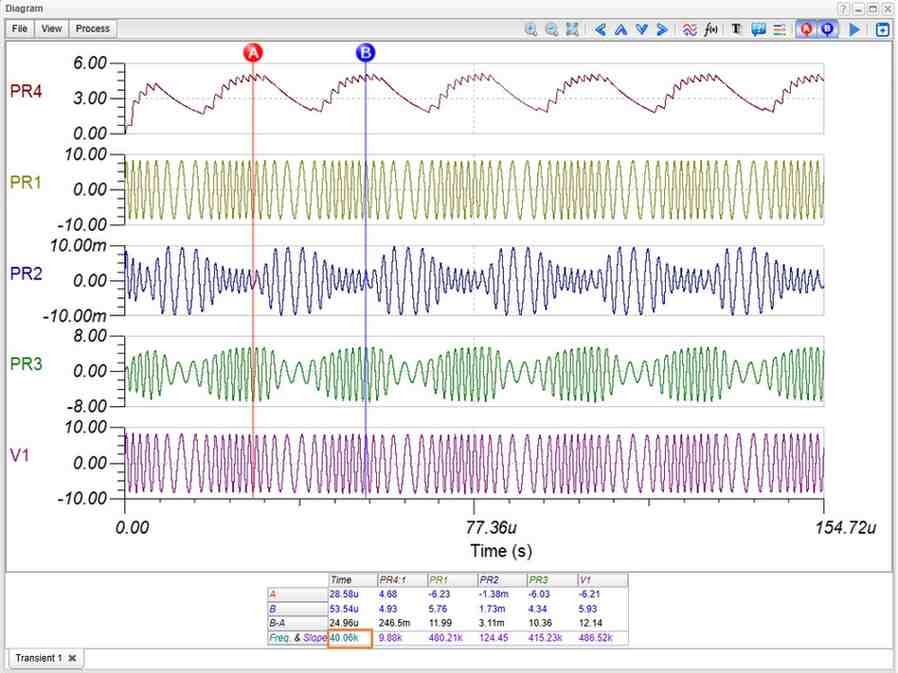
Execute a Transient Analysis. When the graph appears, use the zoom tool to focus on a few periods of the modulating signal. This gives you a clear, uncrowded view of both the raw FM signal and the demodulated output.
Verifying with Cursor Measurements
To verify your output frequency mathematically, place two cursors on the PR4 output waveform. Measuring the time difference between neighbouring peaks allows us to determine the signal period and confirms that the output frequency is indeed 40 kHz, matching the original modulating signal.
Example 3: Active Bandpass Filter
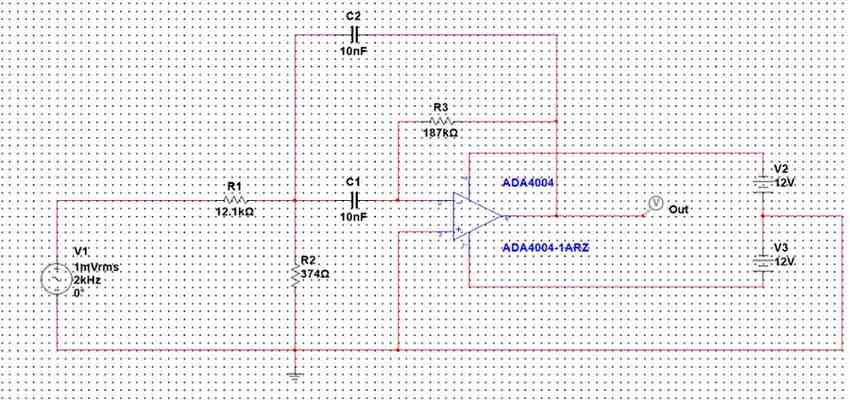
For our third example, we are converting an Active Bandpass Filter. After uploading your .ms14 file to TINACloud, you have options for how you want to manage your files:
- Use the Download command to save the newly converted file locally in TINA’s native
.TSCformat. - Use Save or Save As to store it securely in your cloud-based TINACloud folders.
Advanced AC Analysis Configuration
Go to the menu bar and select Analysis > AC Analysis > AC Transfer Characteristic…
Beyond basic Bode plots, TINACloud is highly capable; it can calculate Amplitude, Phase, Nyquist, and Group Delay diagrams simultaneously. Check the boxes for AC Bode, Amplitude, and Nyquist, and set the number of simulation points to 1000 for a smooth, high-resolution curve. Click Run.
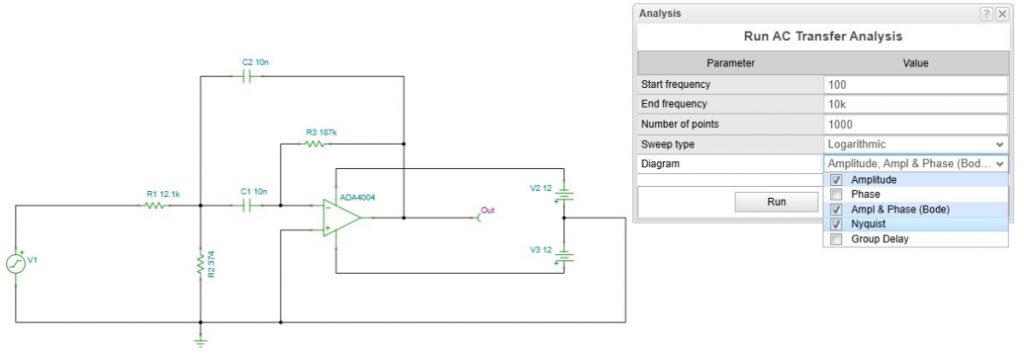
TINACloud will open three separate tabs, neatly separating your Amplitude, Nyquist, and combined Bode diagrams.
Deep Dive: Symbolic Analysis in TINA
One of the most powerful features unique to TINA and TINACloud is the ability to derive a circuit’s Transfer Function symbolically. Instead of just plotting lines based on raw numbers, the engine calculates the exact mathematical formula of the circuit.
This is incredibly valuable for engineers and students looking to study poles, zeros, gain, and absolute frequency responses without relying strictly on numerical guesswork.
⚠️ Note: Symbolic derivation is mathematically reserved for linear circuits. However, you can still easily analyze active filters. By temporarily replacing complex, non-linear operational amplifier models with ideal op-amps, you will achieve highly accurate symbolic formulas.
1. Generating the Formula
Navigate to Analysis > Symbolic Analysis > Symbolic AC Transfer, and click run. The algebraic, analytical form of the Transfer Function will pop up instantly in a new window.
2. Documenting the Schematic
You can stitch this exact formula right onto your schematic diagram for professional documentation. Inside the Symbolic Result window, click the Send to tab and choose Text editor.
(Note: You can tweak or format the equation inside the Text Editor text box if needed). Click OK, and the formula will attach directly to your mouse cursor. Move it to an empty spot on your grid and left-click to drop it in place.
3. Comparing Symbolic vs. Numerical Data
To prove how accurate the symbolic equation is compared to the heavy numerical simulation run earlier:
- In the Symbolic Results window, click Draw Diagram to plot the algebraic formula.
- Click the resulting curve and change its color to green to differentiate it.
- Click the curve again, and select the Copy curve icon to save it to your clipboard.
- Switch back to your original, numerically simulated Ampl 1 tab, and click Paste Curve.
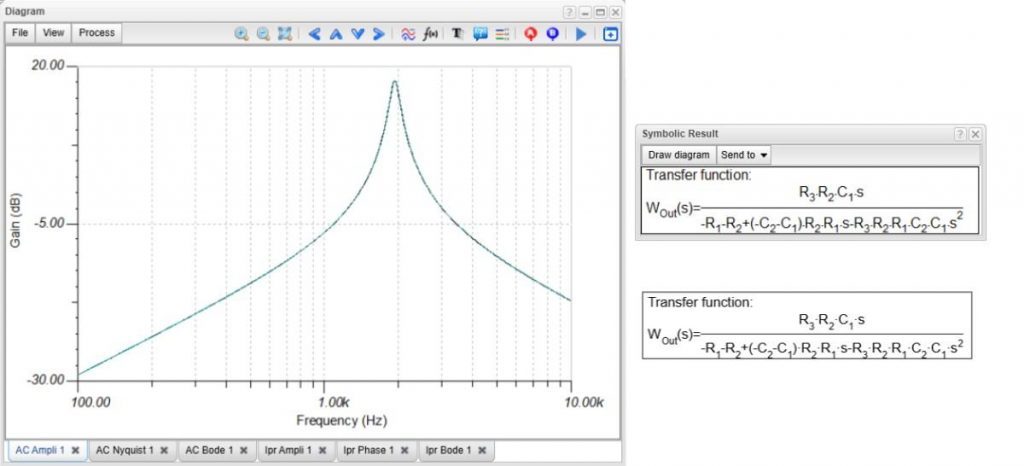
As you will see, the symbolic green line overlays the numerical red line almost perfectly—which is exactly why ideal op-amp approximations are so trusted in filter synthesis.
Example 4: Inverting DC-DC Converter
Our final example is a power electronics circuit: a DC-DC converter built around the popular MC34063 switching regulator from onsemi.
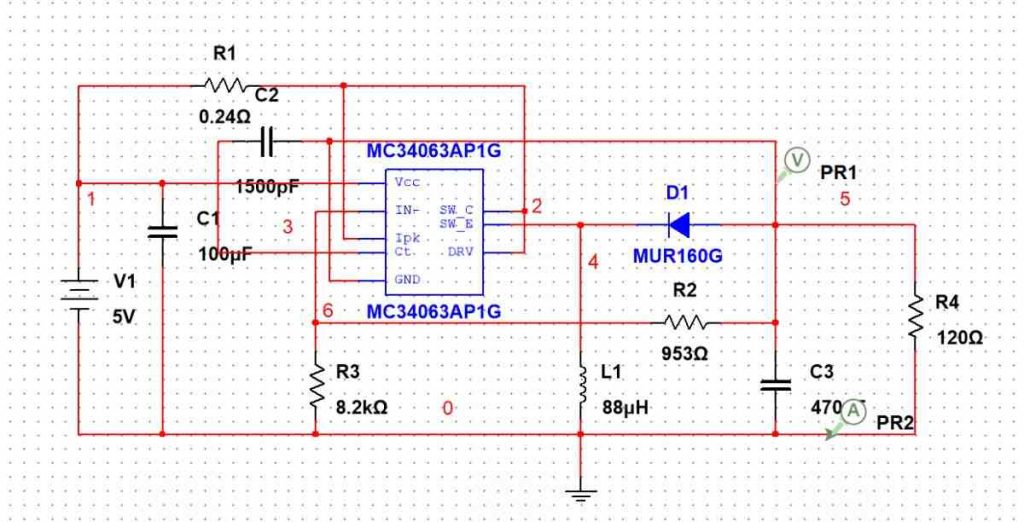
This circuit steps up and inverts a +5V input into a stable -12 output. It is available in both Multisim Live (MSJS) and Multisim Offline (MS14) configurations. Both variants convert seamlessly into TINA, where they run at identical—and often vastly superior—simulation speeds.
Upload and Setup
Save your file, click Upload from TINACloud’s File menu, and open the circuit inside the editor.
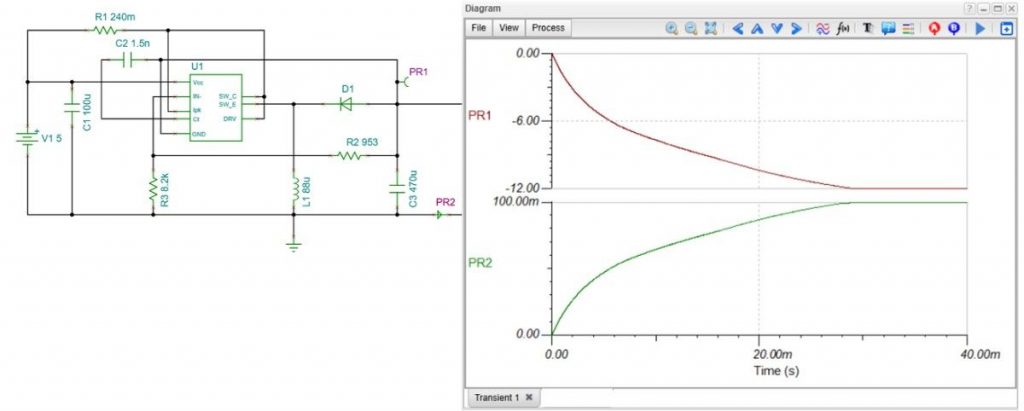
Customizing the Waveform Display
Go to Analysis > Transient Analysis and run the simulation.
When the graph window appears, the waveforms might overlap. To fix this, click the View tab in the diagram menu and select Separate curves. Next, select the PR1 axis line, input your preferred scale values, and repeat the process for PR2. This cleans up the display, creating a presentation-ready look at your input vs. inverted output waveforms.
Wrap-Up & Industry Integration
Whether you are designing basic filters or complex switching power supplies, TINA and TINACloud feature a massive built-in library of specialized DC-DC converter ICs and official evaluation circuits from the world’s leading manufacturers, including:
- Texas Instruments
- Infineon
- Analog Devices
- Nisshinbo Micro Devices
- Würth Elektronik
- STMicroelectronics
- Semtech
Ready to see these step-by-step conversions in action? Check out our full multimedia resources below:
- 📺 Watch the complete video tutorial: Watch on YouTube
- 🌐 Explore the software & features: Visit TINA Official Website
- 🎥 Subscribe for more design insights:
www.youtube.com/@TinaDesignSuite