Microcontroller circuits
Microcontroller circuits
Jump to TINA Main Page & General Information
TINA supports a lot of (PIC, AVR, Arduino, 8051, HCS, STM, ARM, TI-Tiva, TI-Sitara, Infineon-XMC, ESP32 ) microcontrollers; new MCUs are constantly being added. You can see, modify and debug the program running in the processor and, of course, you can create your own code.
There are two ways of providing the program for microcontrollers in TINA. You can use the binary code and debug file made by a standard compiler (e.g. MPLAB for PICs) or you can just load your assembly code to run and debug in TINA using its built in assembler-debugger.
![]() Creating a simple counter circuit using a PIC microcontroller with assembly language programming
Creating a simple counter circuit using a PIC microcontroller with assembly language programming
![]() Creating a simple counter circuit using a PIC microcontroller with C language programming
Creating a simple counter circuit using a PIC microcontroller with C language programming
![]() Basic microcontroller debugging using TINA
Basic microcontroller debugging using TINA
In TINA microcontrollers can be simulated not only alone but also together with analog, digital, HDL or other models.
Running and editing MCU code
Simulation of the esp32c3 microcontroller
Load the PIC Flasher.TSC circuit from the ExamplesMicrocontrollersPic folder.
The following schematic using the 16F73 PIC microcontroller will appear with the 16F73 PIC microcontroller:
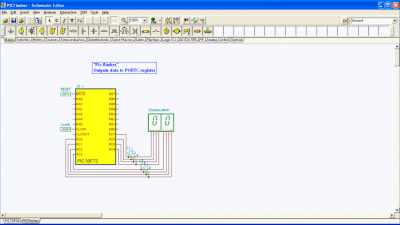
This circuit simply counts forward one-by-one. Press the  button to see how it works.
The display should step forward one-by one.
Double-click the MCU to see the ASM code in it. (see more details in the Quick Start manual).
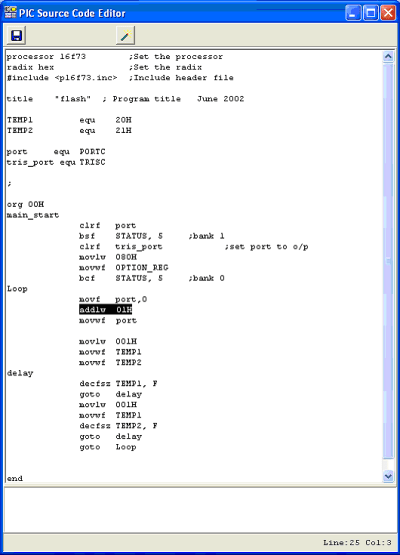
TINA has a great feature whereby you can edit and change the source code directly in TINA.
Lets make the following change in the code:
Change the instruction (selected above) in line 25 (you can see the line number in the right bottom corner of the code editor window):
from addlw 01H
to addlw 02H
Save the changed code to TINA by pressing the  icon and close the open MCU windows.
If you press the button now, the increment will be 2!
Note that the changed code will be automatically saved in the TINA .TSC file.
Using the debugger
Let’s see another application with more interactivity.
Load the PIC16F84interrupt_rb0.TSC example of TINA from the ExamplesMicrocontrollersPic folder.
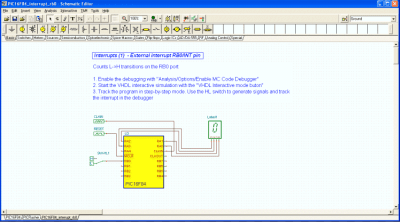
Press the button. It seems at first that nothing is happening.
However, if you click on the SW-HL1 switch., the display will step forward by 1 each time the switch changes from Low to High.
The PIC’s interrupt handling capability will allow us to detect switch changes.
Now let’s see the operation in more detail using TINA’s interactive ASM debugger.
To activate the debugger, select Option on the Analysis menu. Then set the “Enable MCU Code debugger checkbox”, as shown below on the Analysis Options dialog box.
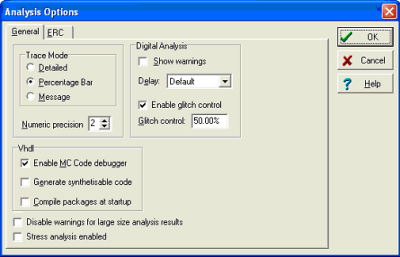
Press the OK button and the MCU debugger will appear:

Let’s follow the program execution step-by-step by pressing the  Trace Into button.
After around 14 clicks we get to the PT1: label where the program seems to be in an infinite loop.
PT1: INCF TEMP, F GOTO PT1

 Trace Into button twice. The program will recognize the interrupt and jump into the
NT_SERV: label.


INT_SERV:
INCF  COUNTER,
F MOVF COUNTER,
0 MOVWF
PORT
increment the COUNTER and copy to PORT A, and the output will be 1. After this the program will return to the “infinite loop” at PT1.
Editing the code in the debugger
Now let’s make a small change in the program to demonstrate the use of the debugger. Duplicate the INCF COUNTER, F statement using Copy and Paste like this:
        INT_SERV:
        INCF COUNTER, F
        INCF COUNTER, F
        MOVF COUNTER, 0
        MOVWF PORTA
Now when you press the the program will ask:
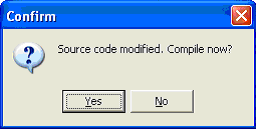
Press Yes and press the button again. Now the increment will be 2 at each Low-High change of the switch.
You can also check the circuit in the continuous Running mode of the debugger by pressing the  button.
Even though the debugger will run fast, you can still see the “infinite cycle’ and then the jump to the Interrupt server part ( INT_SERV: ) when you change the switch.
Making a breakpoint
Using the step-by-step mode, it is often impossible to get to a particular point in the program. Even if you are patient enough to step a thousand steps, the program’s flow might not allow you to step where you want.
To stop at particular line, you can mark the target statement by setting a “breakpoint”.
Run the program in the continuous mode of the debugger using the Run command and now the program will stop at the desired line before executing the marked command.
To demonstrate this, click on the increment statement in our interrupt server after the INT_SERV: label and press the  Toggle break button.
Now press the Run button. The program starts to run in an “infinite cycle”.
Even though you have set a breakpoint, code execution will not stop because it never gets to the breakpoint. However, when you change the switch from Low to High the program will stop at the marked statement:
   INT_SERV:
             INCF COUNTER, F
Now you can continue either step by step or in the Run mode