Nonlinear
Microwave Circuit
Analysis
with Harmonic Balance
Nonlinear Microwave Circuit Analysis with Harmonic Balance
In TINA v16 and later versions, you can analyze nonlinear RF and Microwave circuits using the Harmonic Balance analysis method. The advantage of this approach is that it does not require detailed time-domain simulation, which can be prohibitive for GHz-range signals. Instead, you simply specify the desired base harmonics, and the program calculates and displays the resulting spectrum lines. Example circuits for Harmonic Balance analysis can be found in the Examples\RF\HB folder of TINA.
Let’s see a few examples.
Frequency Tripler Circuit
Open the Tripler BJT.TSC circuit from the Examples\RF\HB folder of TINA.
This frequency tripler circuit generates a 2.4 GHz output signal, exactly three times the 800 MHz input frequency, using a high-frequency bipolar transistor (MMBR941).
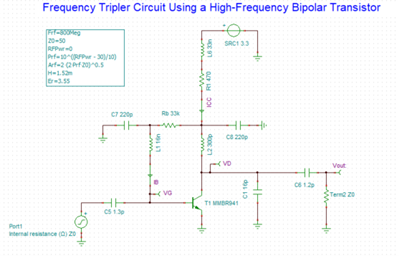
To obtain the output spectrum, run Harmonic Balance Analysis from the Analysis menu using the settings below. Make sure to select Vout in the Output field.
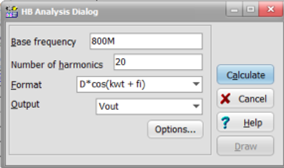
The following spectral voltages will be displayed.
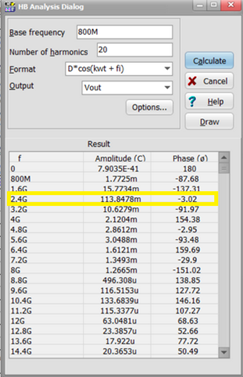
Observe that the dominant spectral component appears at the third harmonic (2.4 GHz) with an amplitude of 113.85 mV, while the fundamental component at 800 MHz is significantly lower at only 1.77 mV. This confirms correct frequency-tripling operation.
You can also display the spectrum lines graphically by clicking the Draw button in the Harmonic Balance Analysis dialog.
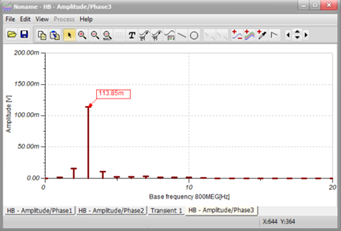
Note that you can display the numeric values of the spectrum lines by clicking the (Auto Label) button on the diagram, and then clicking the top of a spectrum line.
You can also specify the desired spectrum lines directly by listing their frequencies. This is particularly useful when some spectrum lines are far from the base frequency, as defining them as multiples of the base frequency would require an excessive number of spectrum lines.
AM Demodulator with PIN Diode
To illustrate this technique, open the AM Demodulator with PIN Diode.TSC circuit file from the Examples\RF\HB folder in TINA.
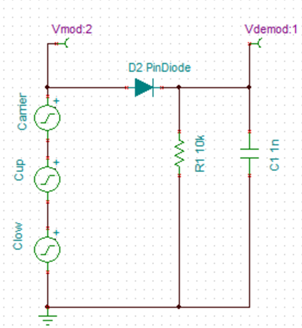
This is a simple PIN diode detector circuit with an RC low-pass filter at its output.
The AM signal is represented by three generators: one at the 1 GHz carrier frequency and two generators forming the upper and lower sidebands, each spaced 100 kHz from the carrier.
Now calculate the amplitude of the modulating signal at the output of the PIN detector using Harmonic Balance analysis.
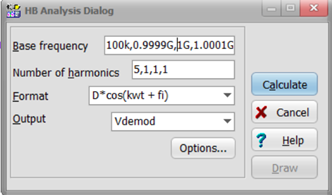
Select Harmonic Balance Analysis… from the Analysis menu. The HB Analysis Dialog appears.
As described previously, in this case we specify only the three known frequencies in the HB Analysis dialog, rather than calculating all spectrum lines from the base frequency, since this would otherwise require calculating 10,000 spectrum lines. However, for the 100 kHz base frequency we require the calculation of five spectrum lines due to the distortion introduced
by the diode.
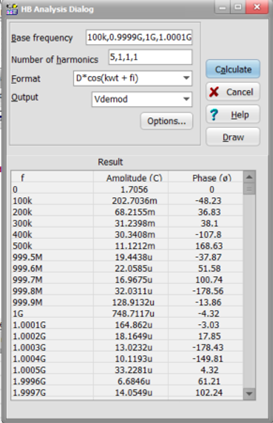
Now press the Calculate button, and the values of the spectral voltages appear.
Note that, although it is not required, the waveforms can still be calculated using transient analysis at these frequencies.
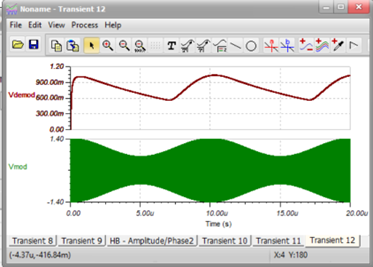
Select Transient from the Analysis / Transient… menu. The Transient Analysis dialog appears.
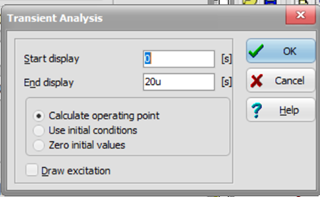
Press the OK button. After a short calculation, the waveform of the AM signal and the demodulated signal appear in the diagram window.
We can also double-check the results of the Harmonic Balance analysis using Fourier series analysis.
To perform the Fourier Series analysis, click the upper demodulated signal. Select Fourier… from the Process menu of the dialog window. The
Fourier Series dialog appears.
Make sure that the Base frequency is set to 100 kHz.
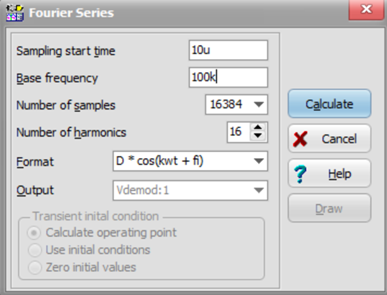
Press the Calculate button. The Fourier Series spectrum appears.
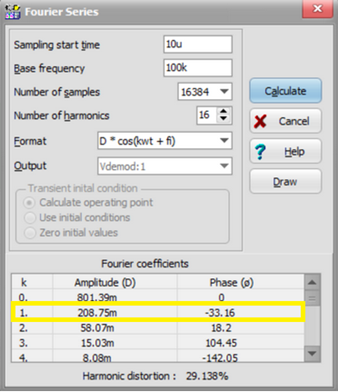
The calculated 208.75 mV at 100 kHz is very close to the 202.70 mV calculated using the Harmonic Balance method.
Finally, note that, as we have seen in this example, the growing performance of modern computers makes time-domain methods increasingly competitive with the Harmonic Balance method.